vellumverse hex logo vellumverse hex logo vellum gallery
  • Home
  • Gallery
  • About
  • Ecosystem
    • vellum (the backend)
    • vellumplot (the grammar)
    • vellumwidget (interactive)
    • vellumverse (the meta-package)
Categories
All (30)
Backend (3)
Basics (4)
Big data (5)
Composition (3)
Effects (3)
Heatmaps (2)
Interactive (2)
Networks (1)
Polar (2)
Spatial (5)
Statistical (4)
Text (1)

Gallery

Plots and interactive widgets built with the vellum ecosystem. Every example is real, runnable code.

Each card is a self-contained example. Click through for the code and the rendered result. Everything is drawn by vellumplot on the Rust-backed vellum engine.
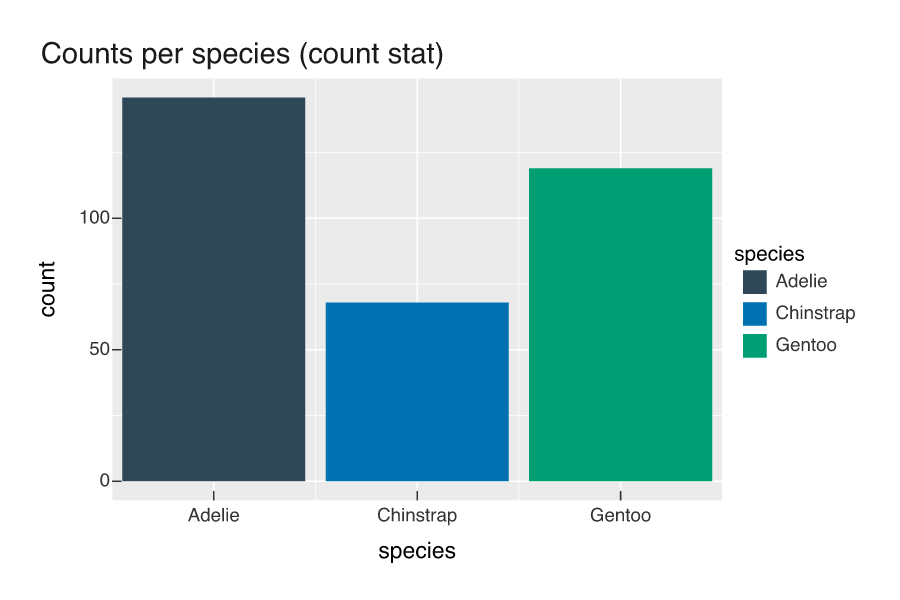
Bar chart with a count stat
Basics

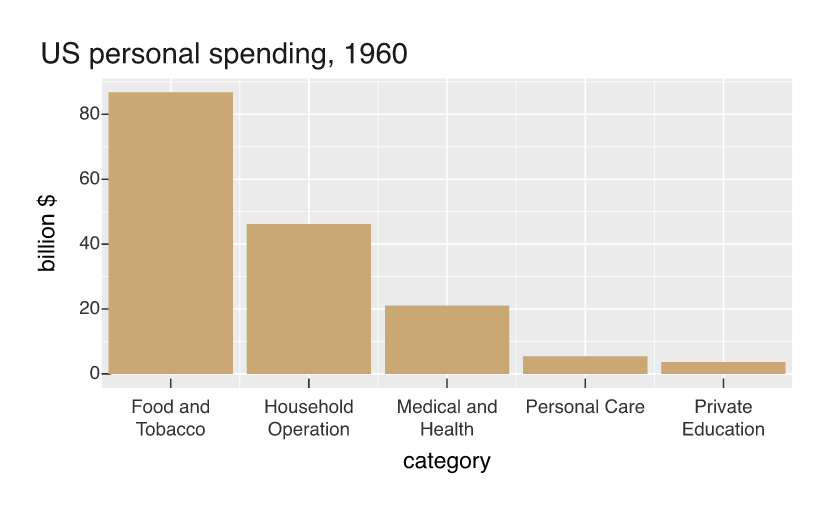
A bar mark that counts rows per category: the count stat, used when no y is supplied.

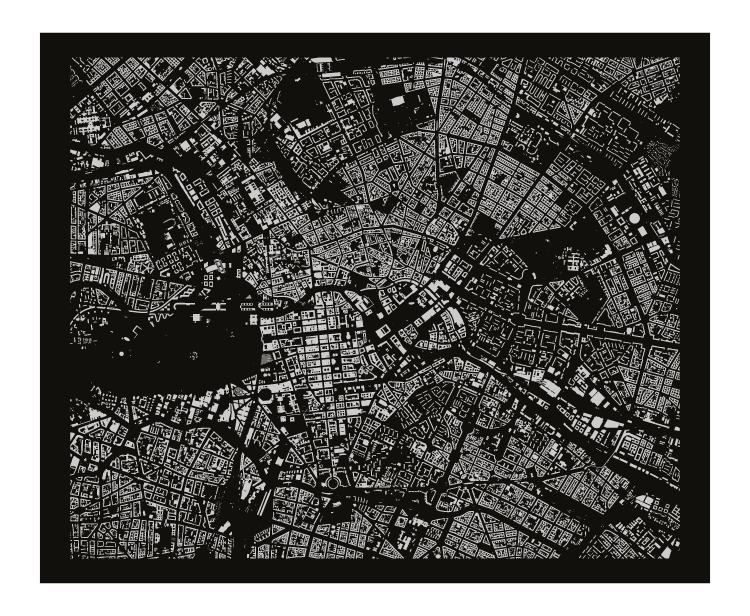
Every building in Berlin
Spatial

536,700 building footprints from OpenStreetMap, assembled into polygons and drawn with mark_sf(). The streets are the gaps.

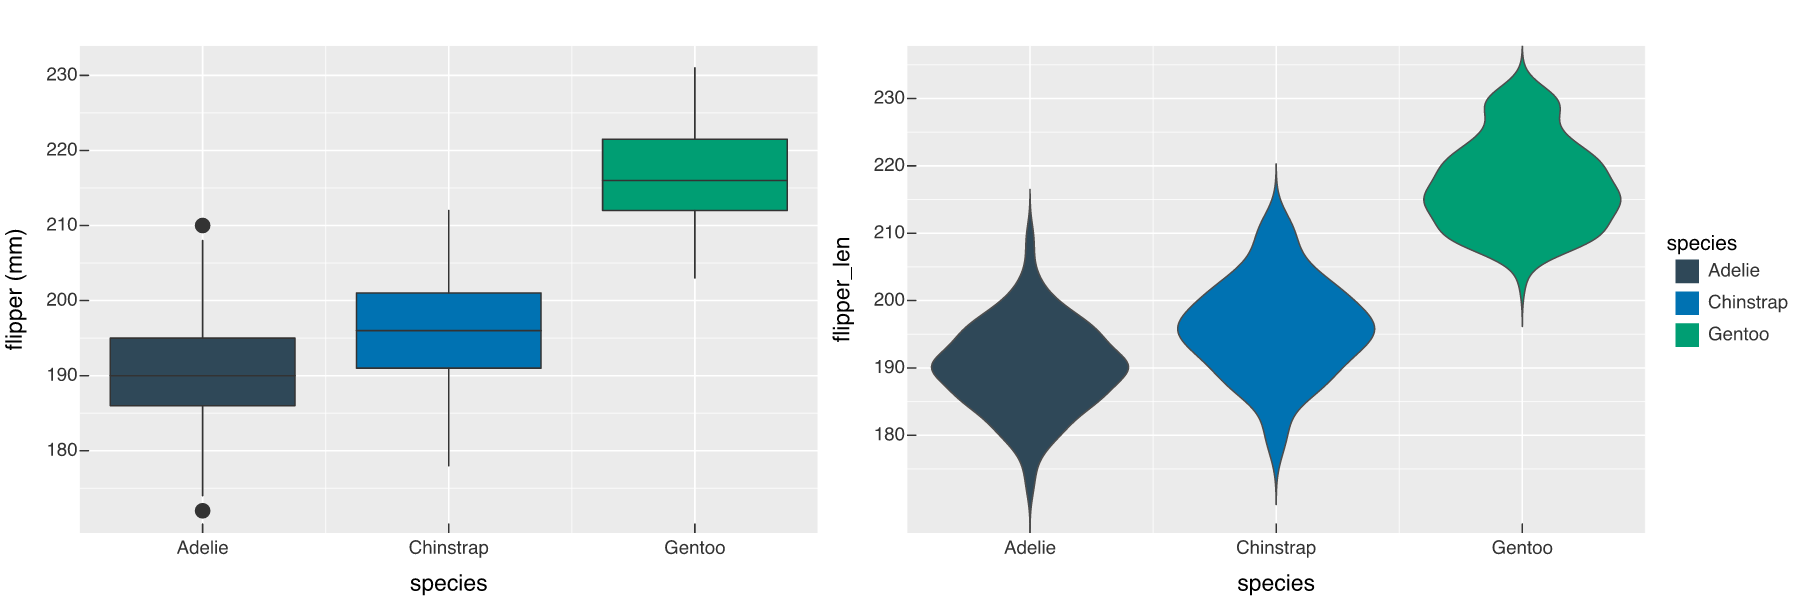
Boxplots and violins
Statistical

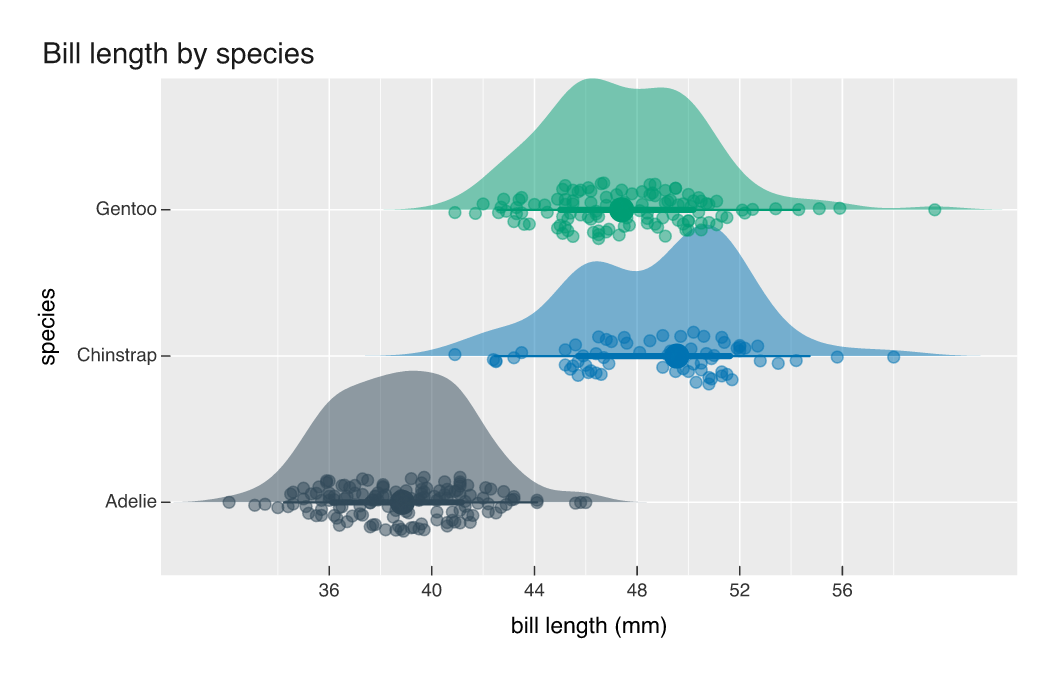
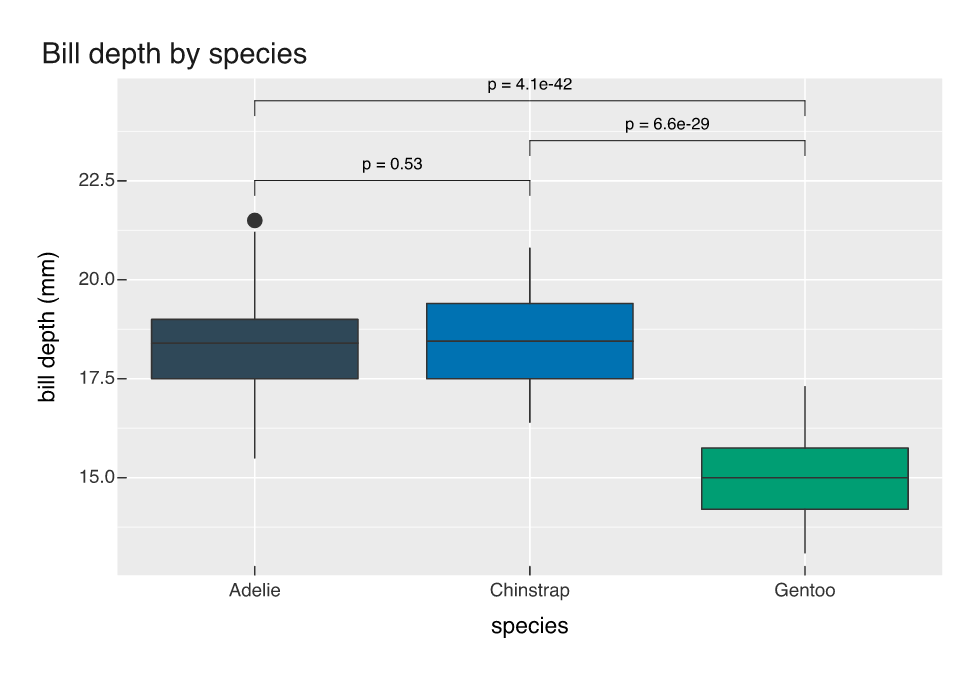
Two views of the same grouped distribution: a boxplot and a violin, side by side.

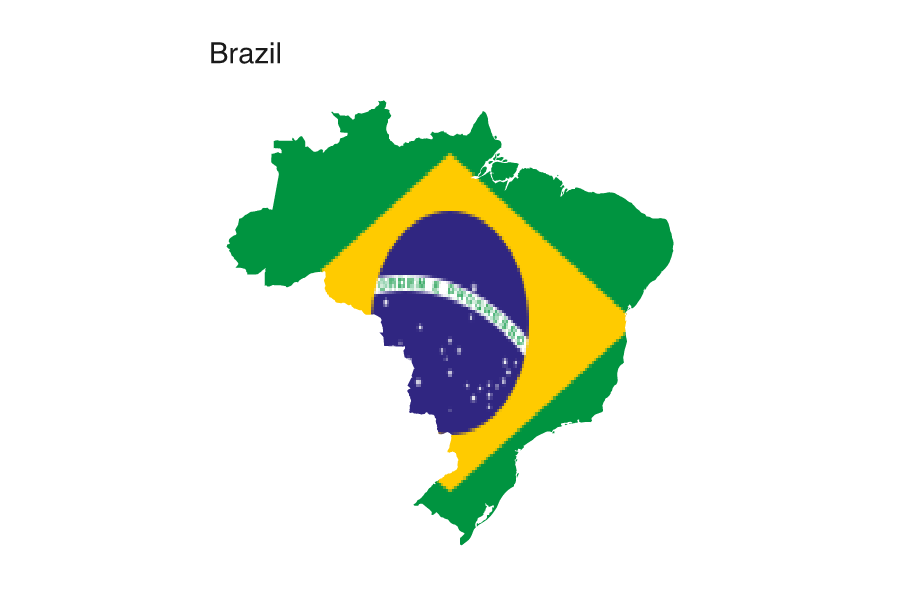
Choropleth map
Spatial

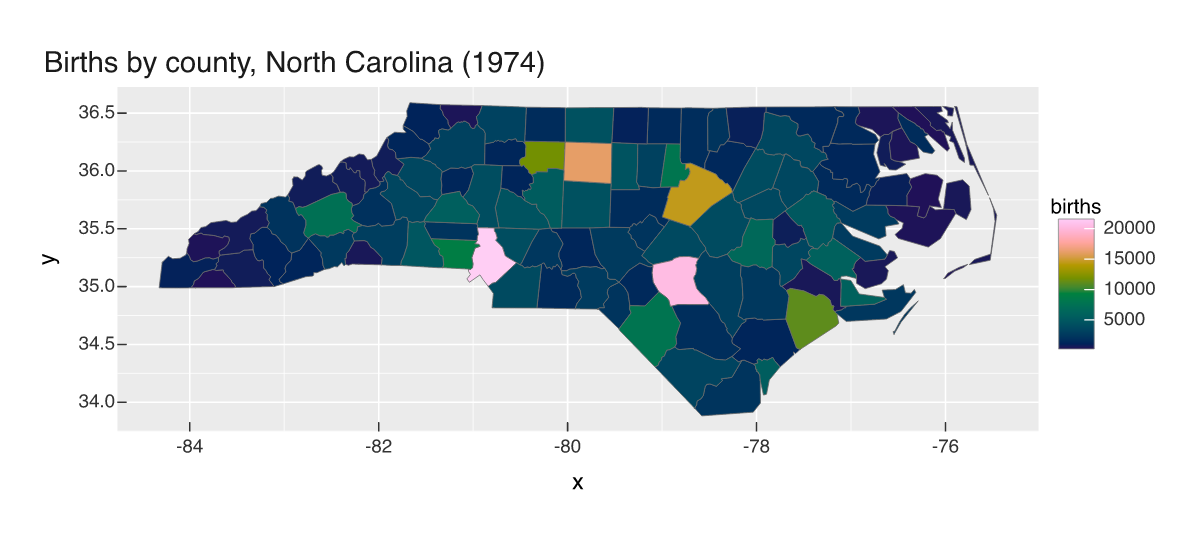
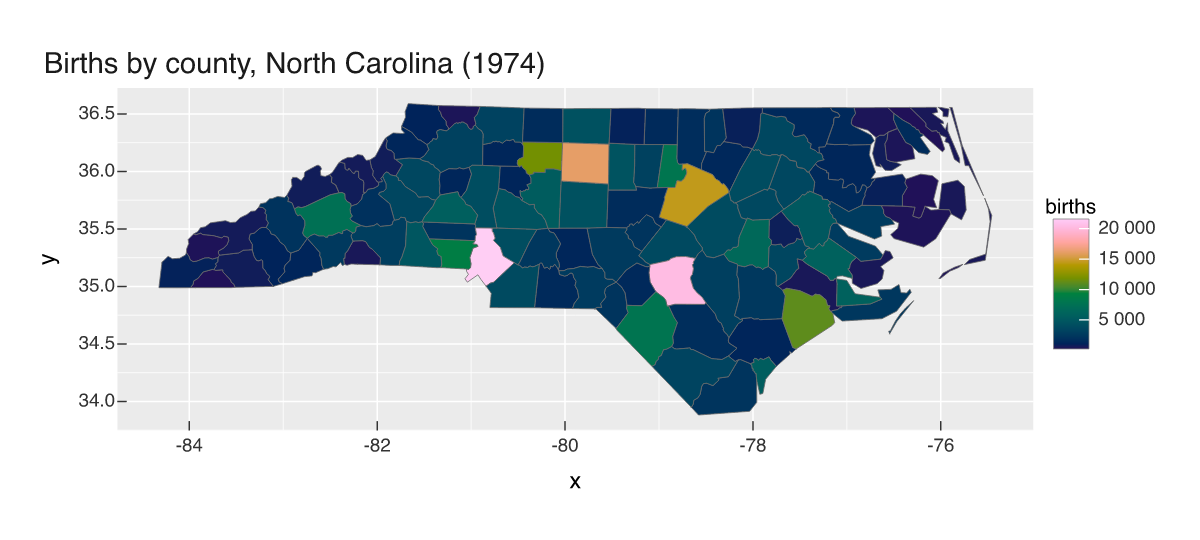
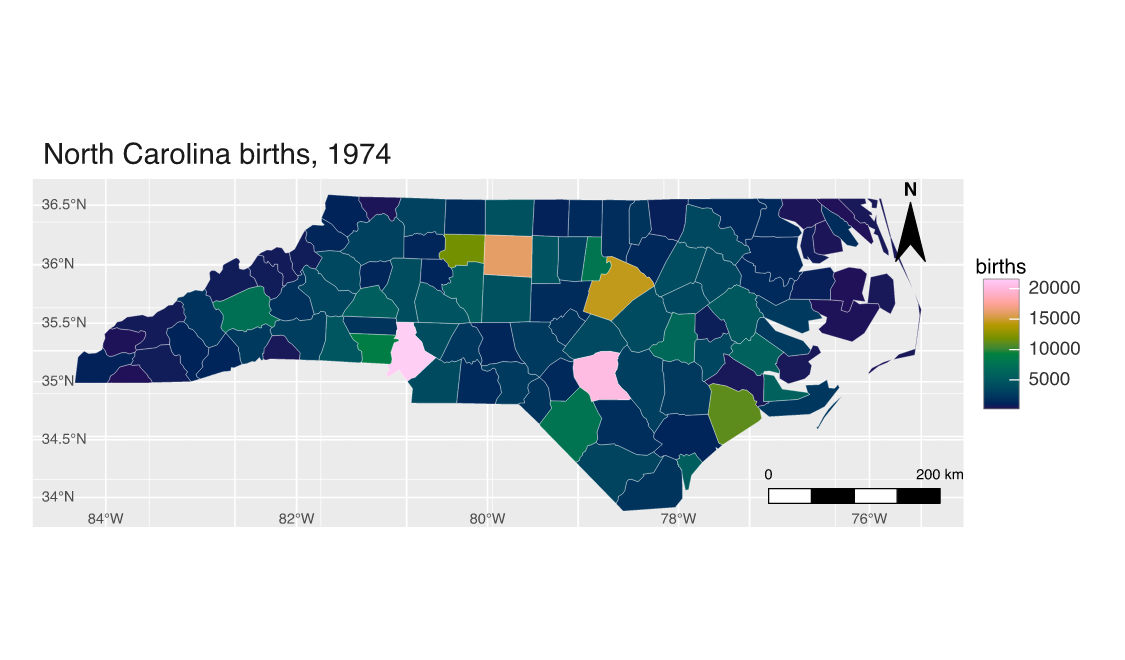
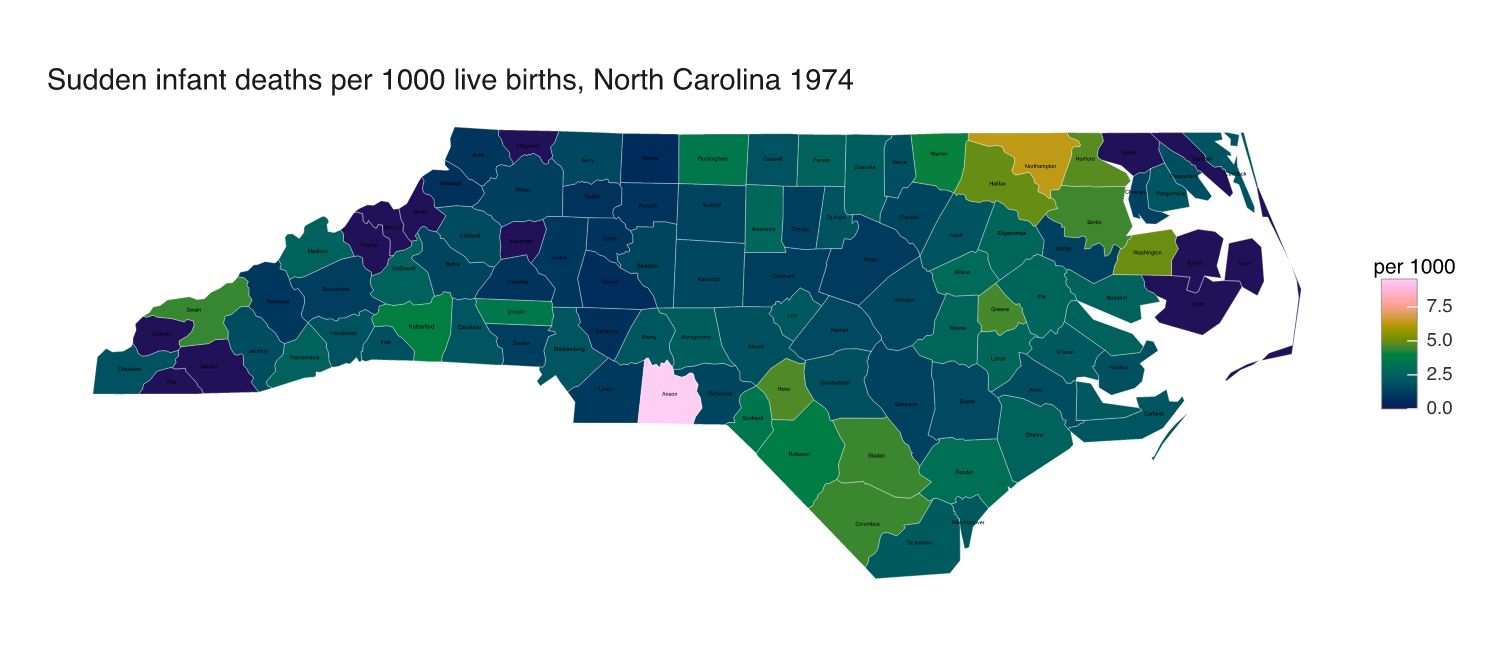
An sf object drawn directly with mark_sf() and a proper map projection via coord_sf().

Composing plots
Composition

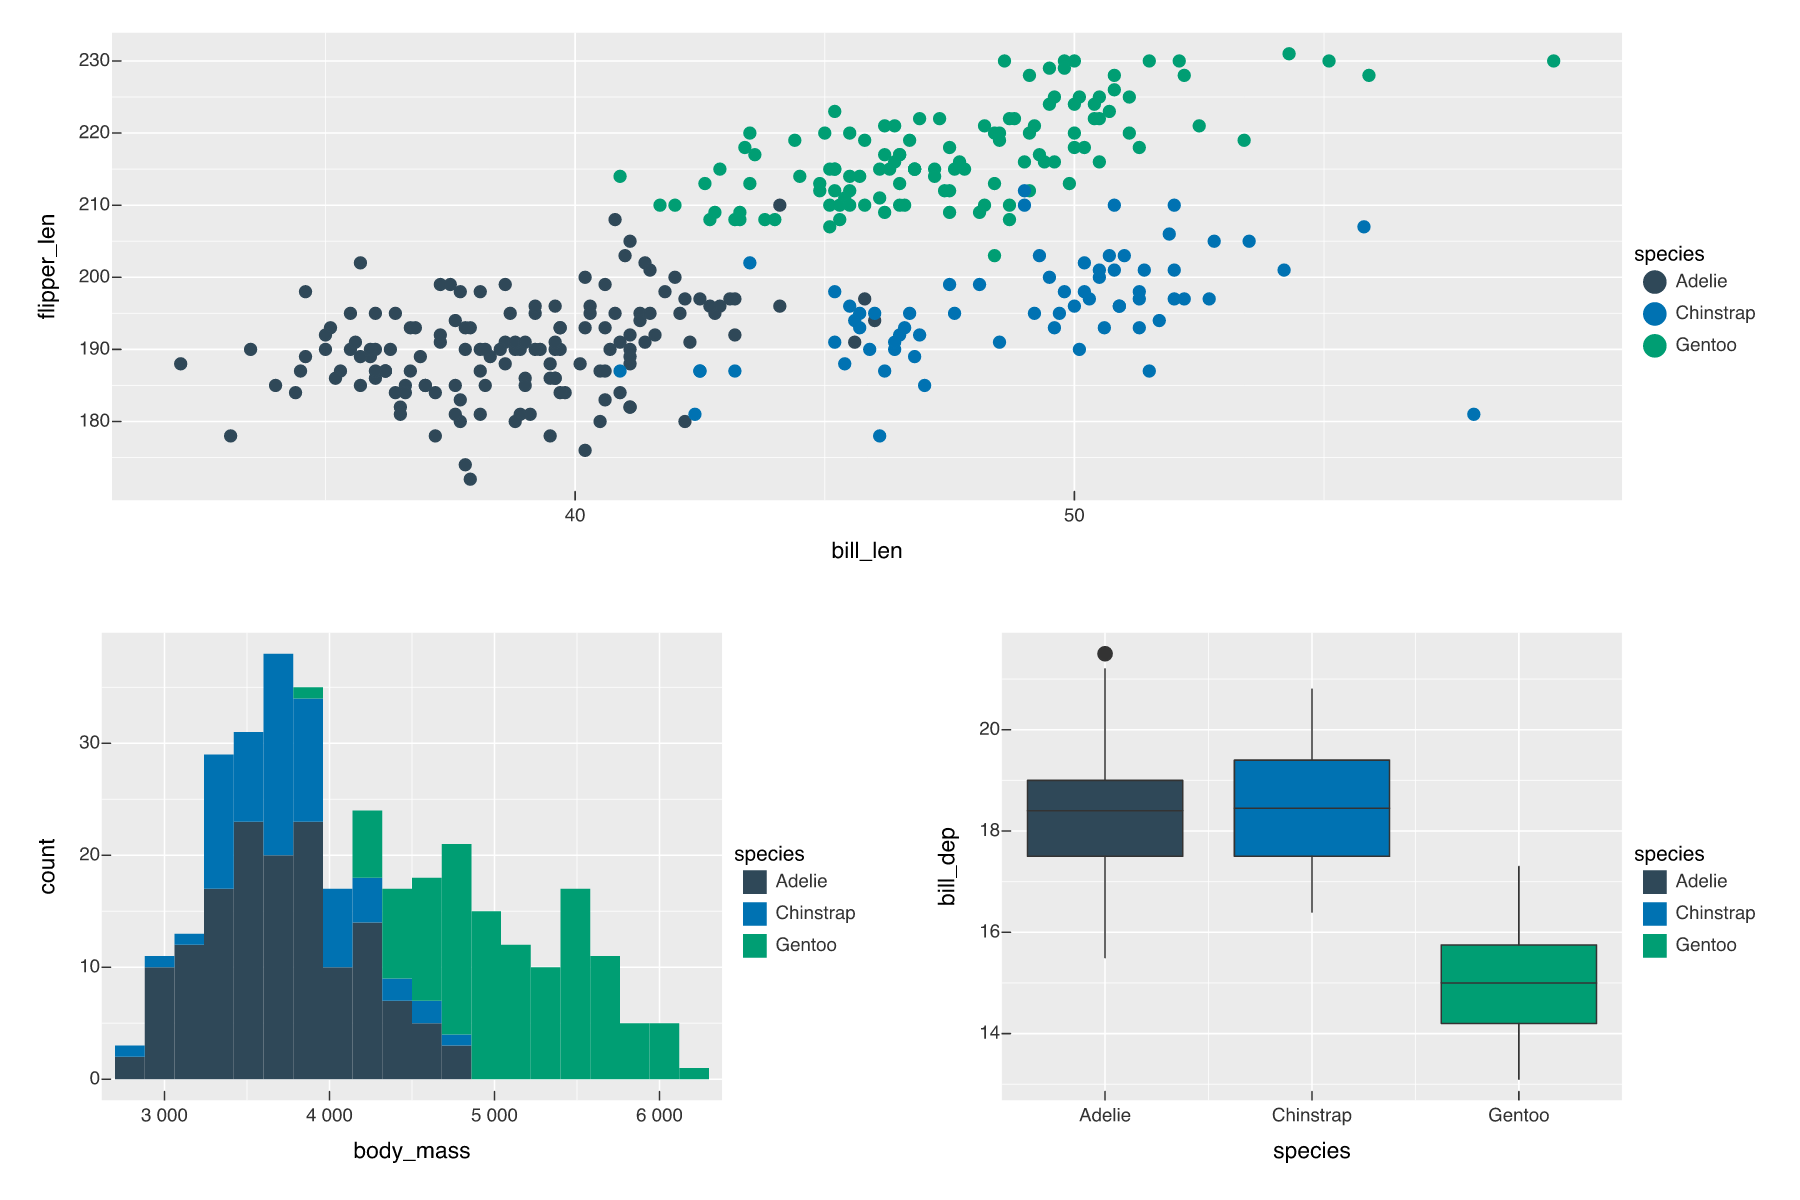
Arrange several independent plots into one figure with a patchwork-style design string.

Correlation matrix
Heatmaps

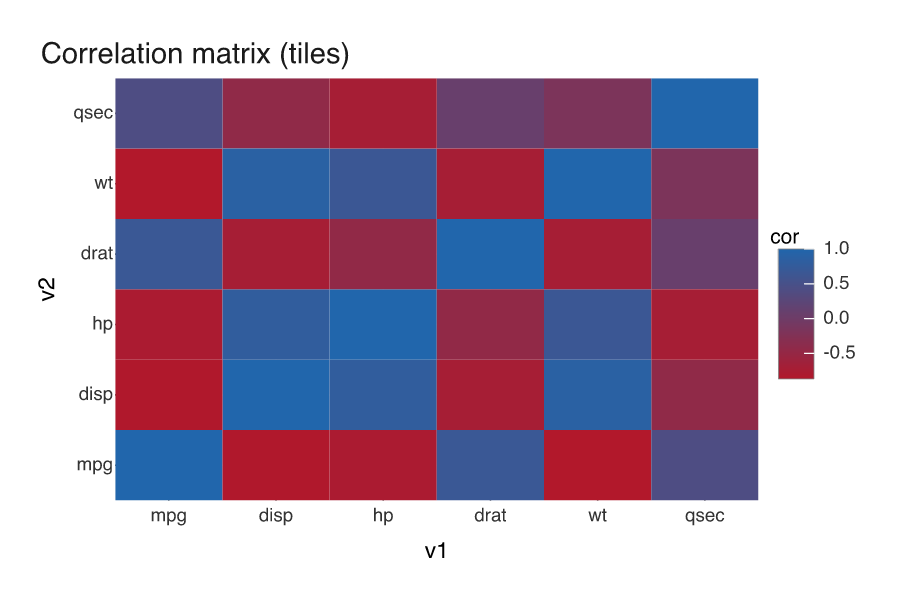
A heatmap of a correlation matrix drawn with tile marks and a diverging fill scale.

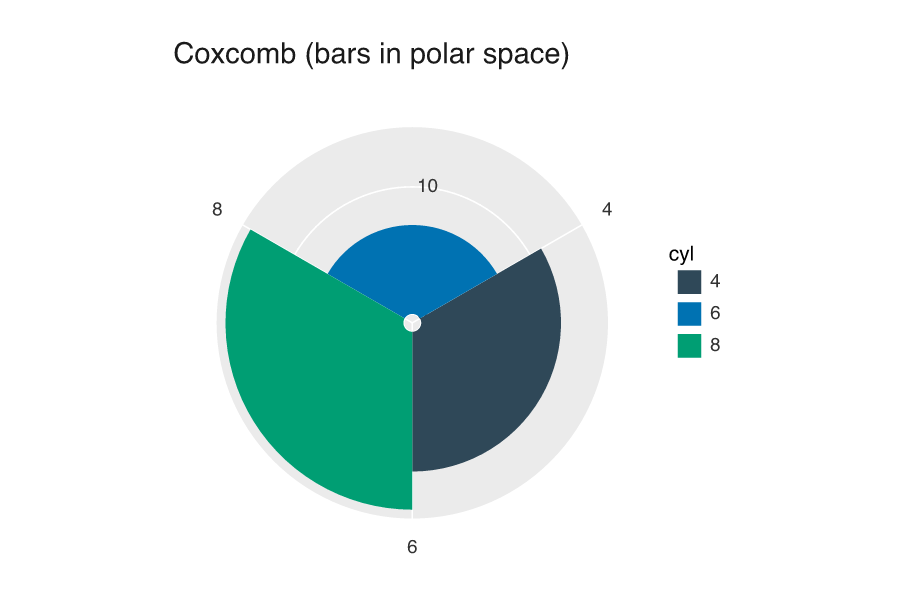
Coxcomb (polar bars)
Polar

Bars mapped into polar space: a Nightingale-style coxcomb via coord_polar().

Linked views with crosstalk
Interactive

One SharedData, four coordinated views: brush a plot to highlight the others, and filter inputs cross-filter them all. Client-side, no Shiny.

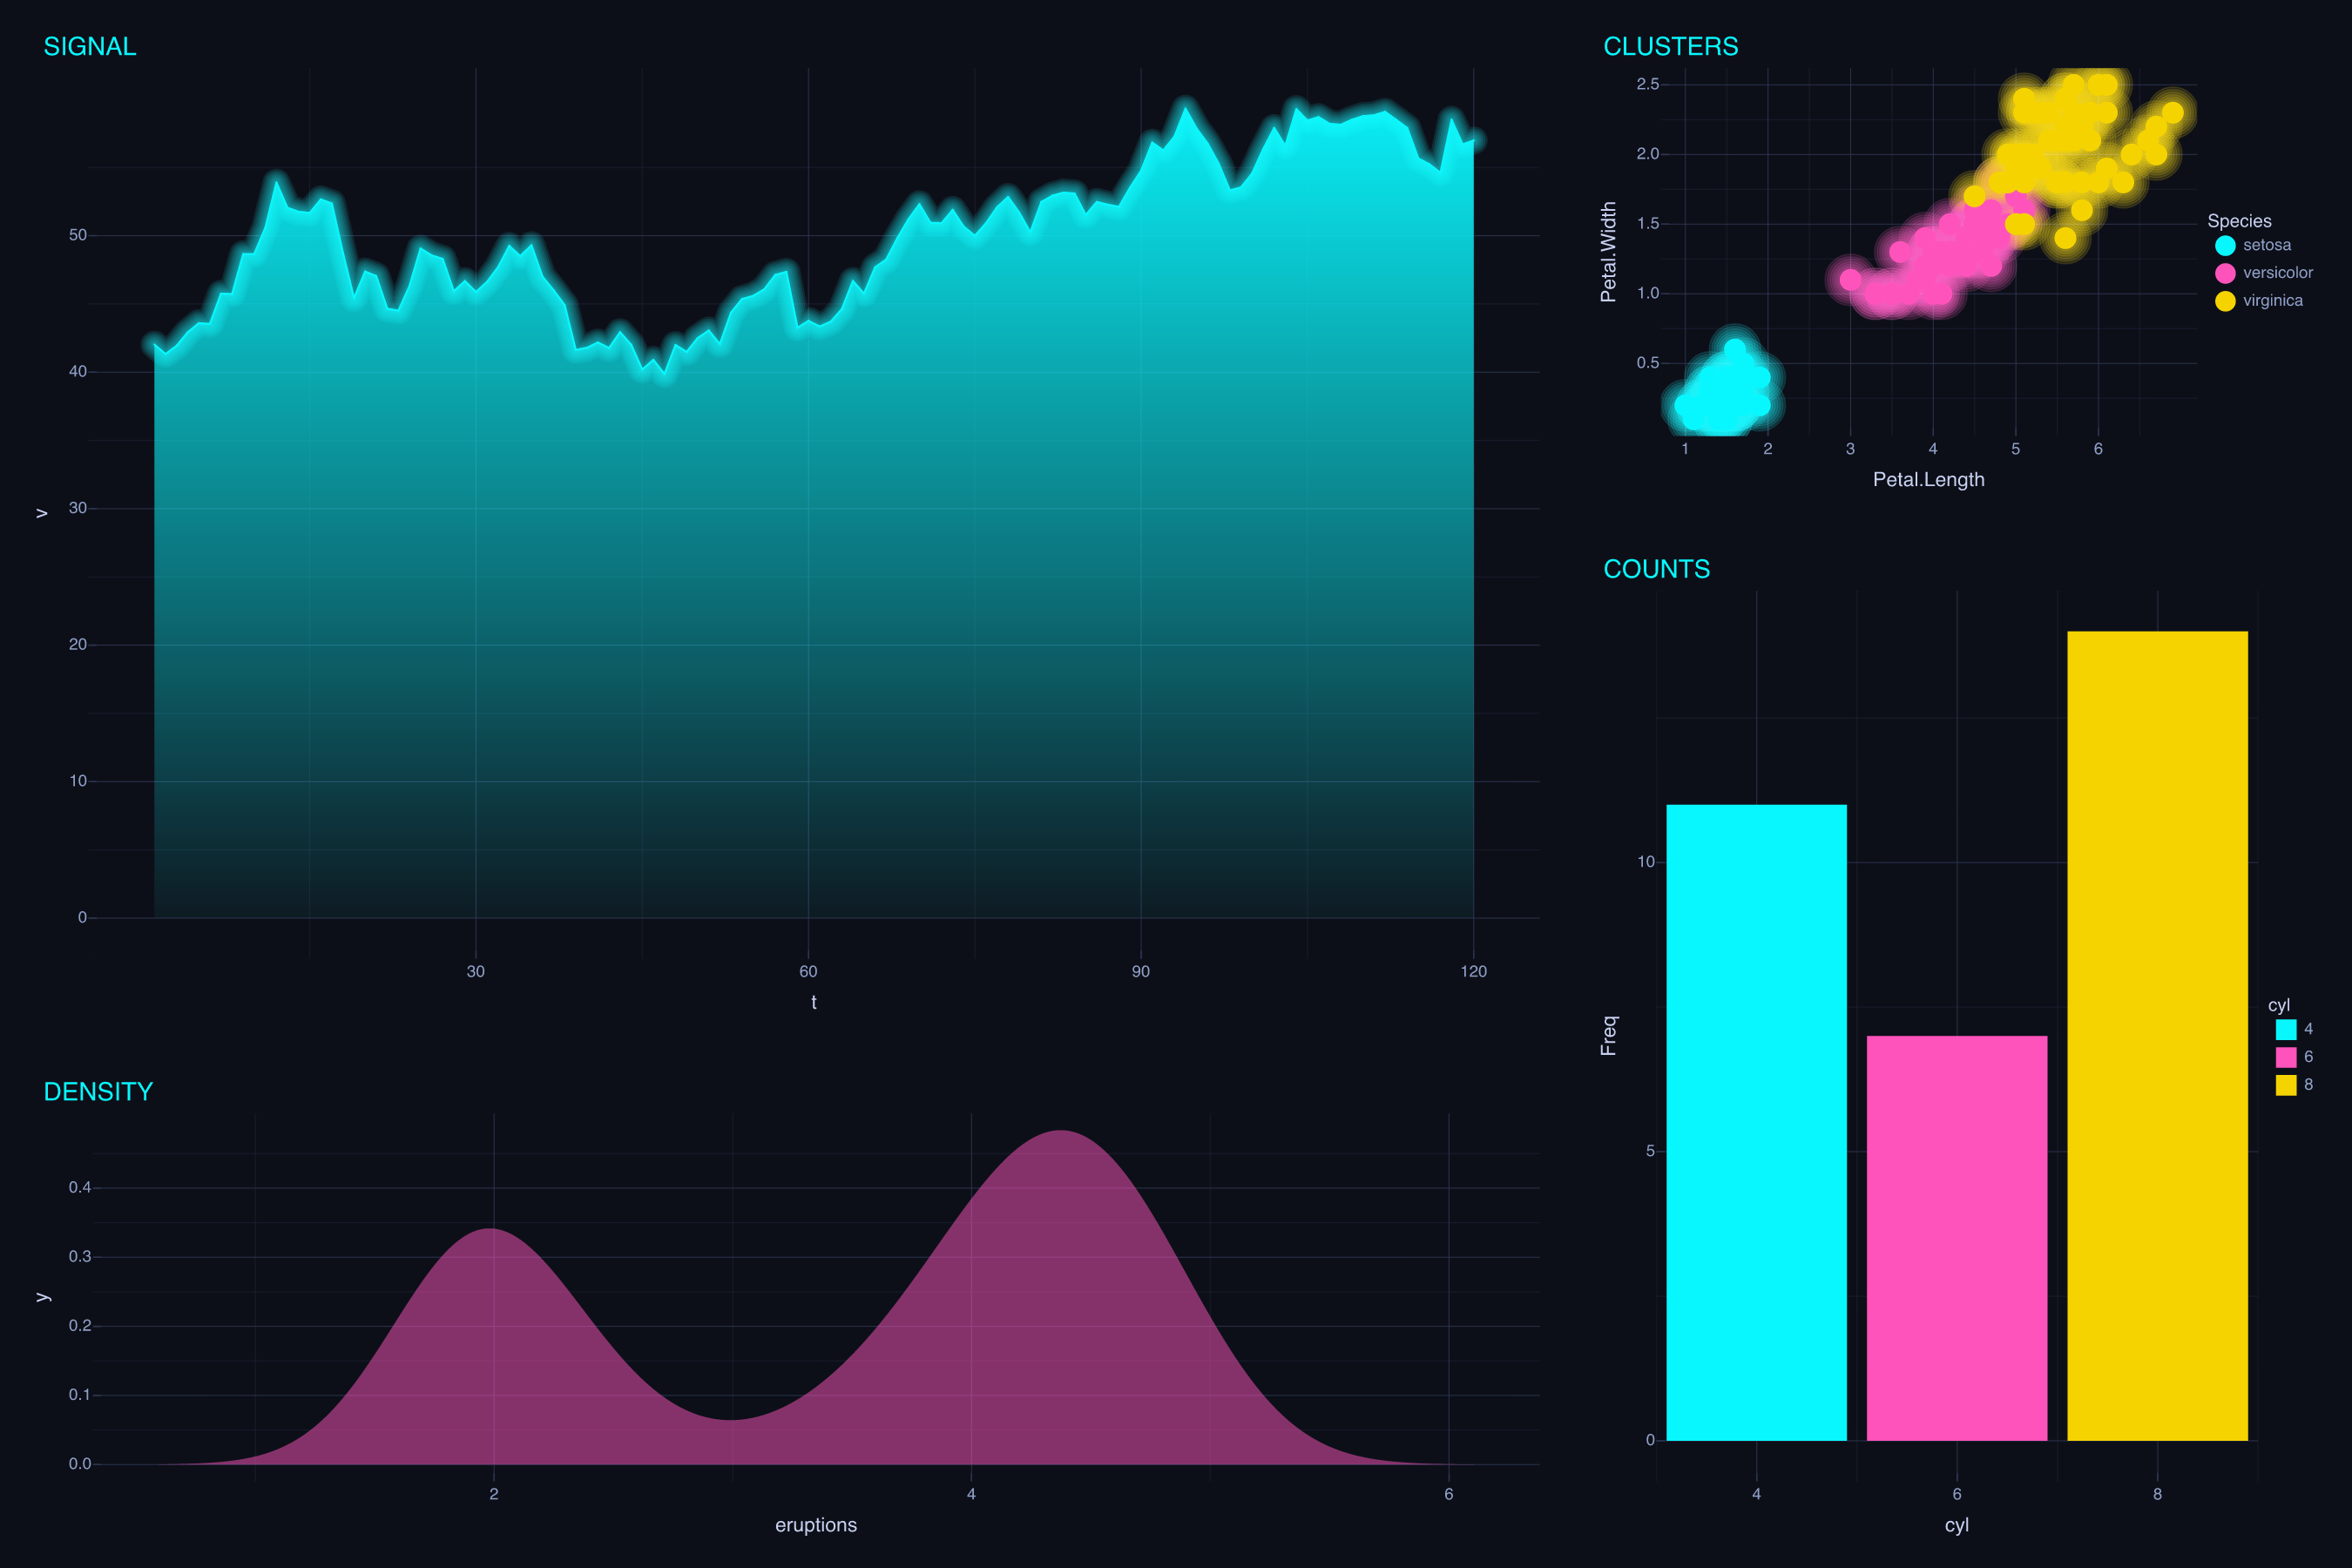
Cyberpunk dashboard
Composition
Effects

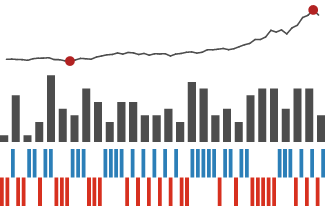
Four neon panels composed into one dark dashboard with a design string, glowing lines, and a gradient area fill.

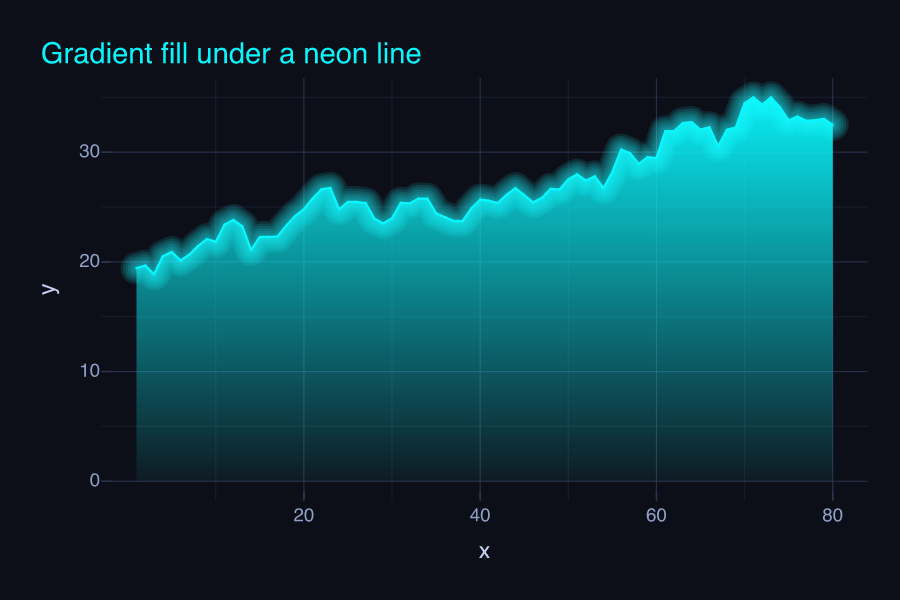
Neon glow and gradient fill
Effects

A high-contrast cyberpunk theme with a glowing line and a gradient area fill.

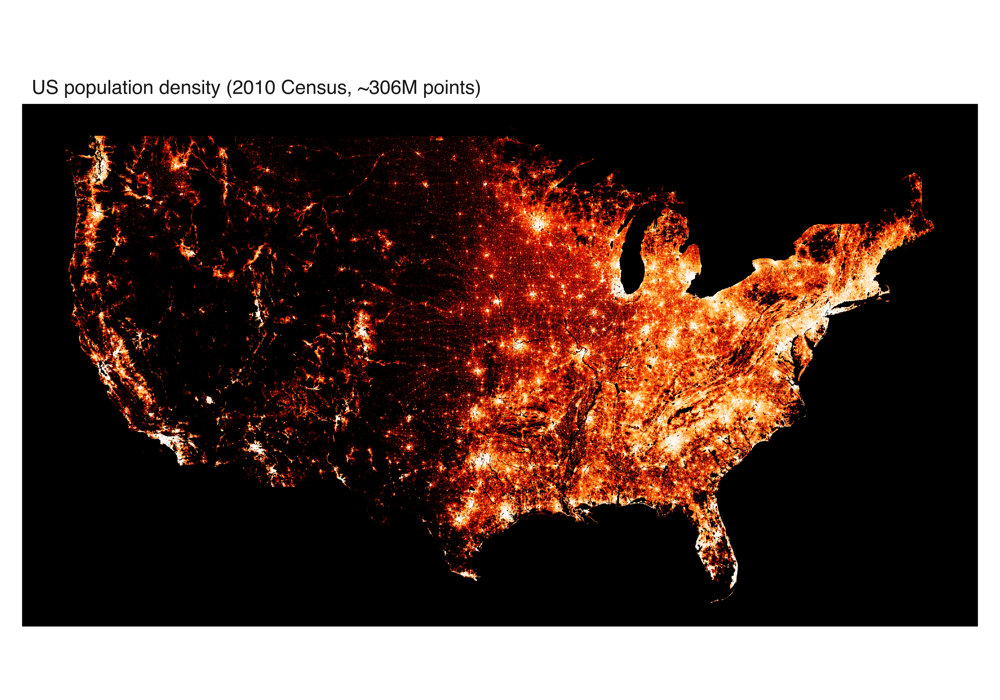
The US Census, all 306 million points
Big data

Datashading the full 2010 US Census (population density and an additive per-race composite), reproducing the classic datashader example.

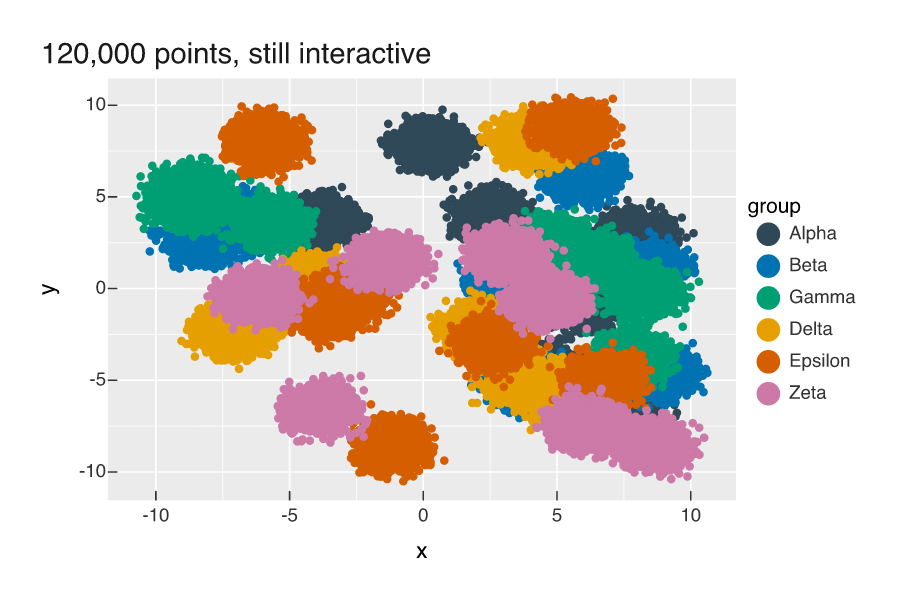
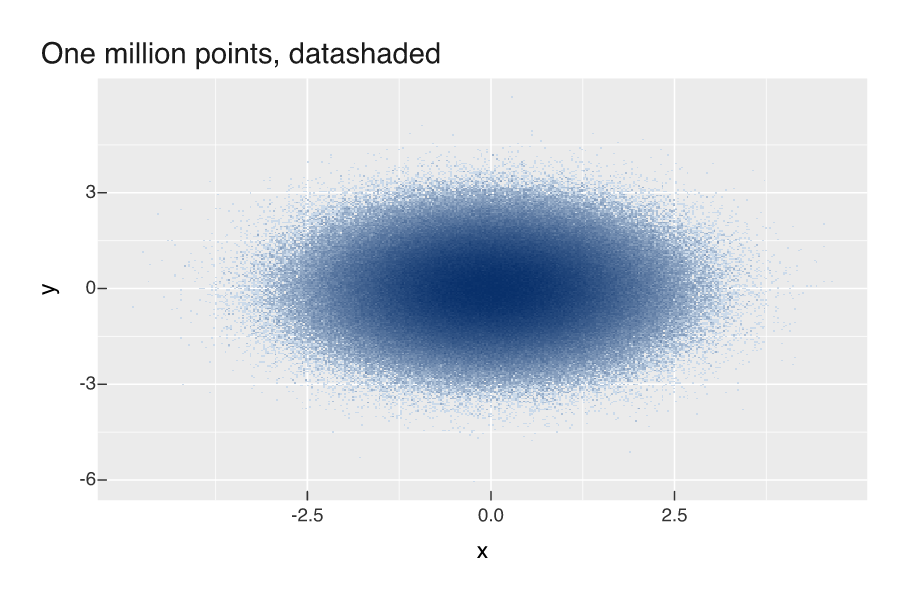
Datashading a million points
Big data

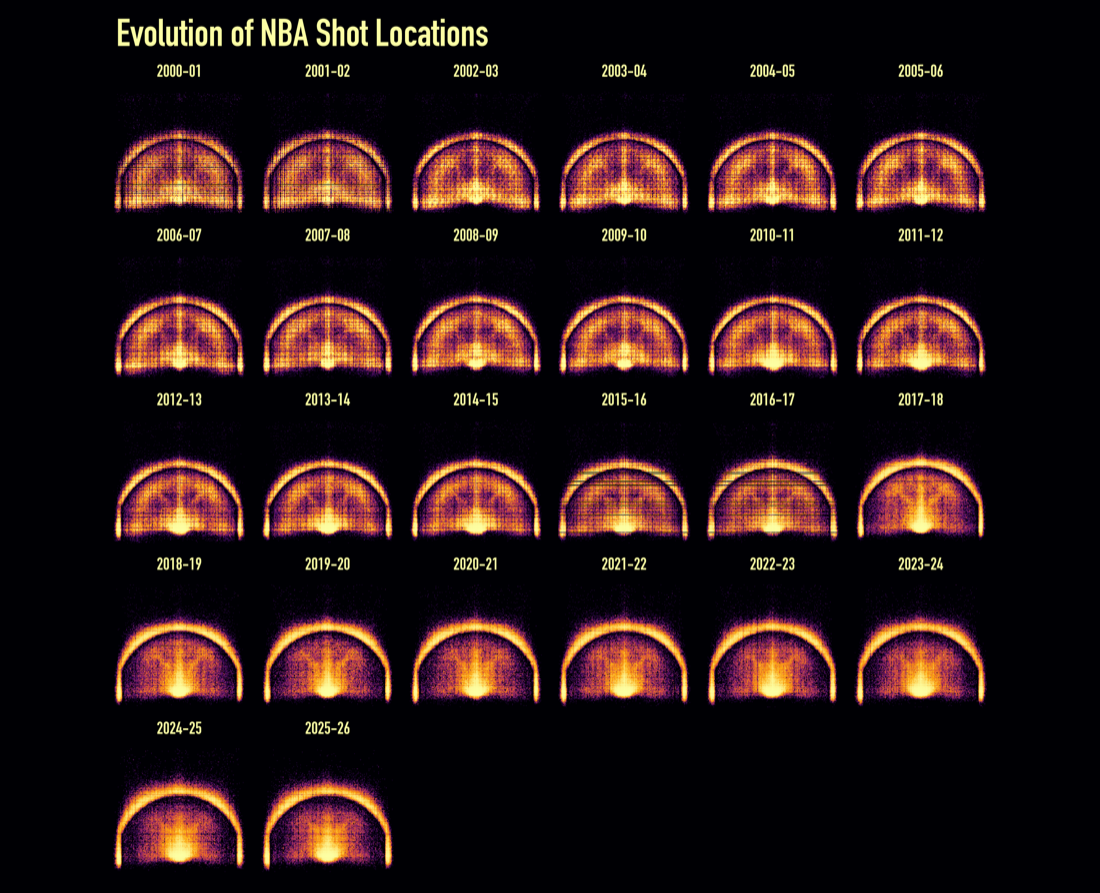
Aggregate-then-shade rendering that stays fast and legible at a million points.

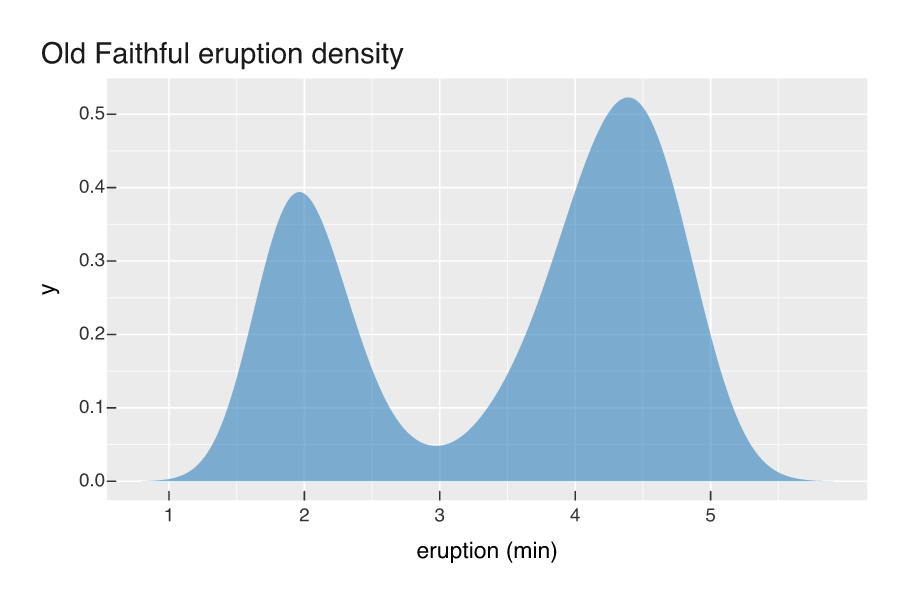
Density curve
Statistical

A kernel density estimate as a filled area, with an adjustable bandwidth.

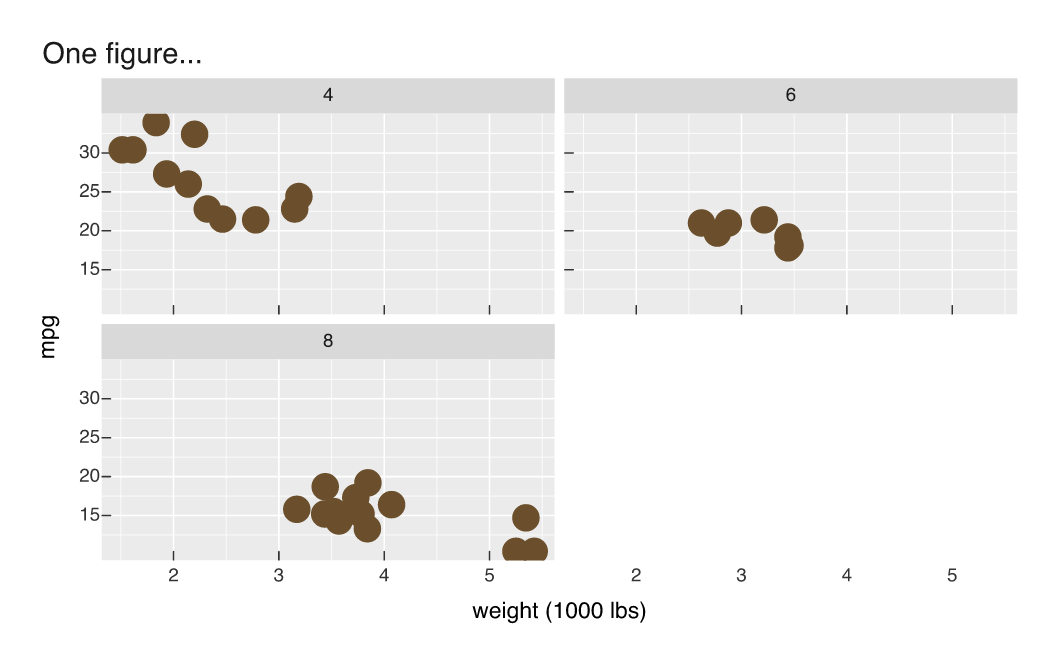
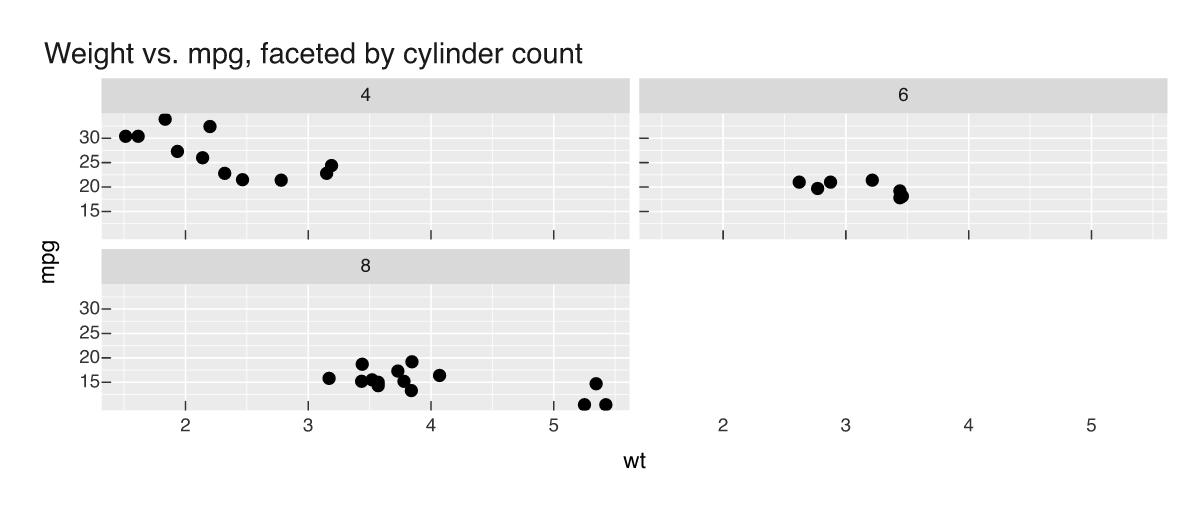
Faceting
Composition

Small multiples: one panel per level of a grouping variable with facet_wrap().

OpenStreetMap Germany, two ways
Spatial
Big data

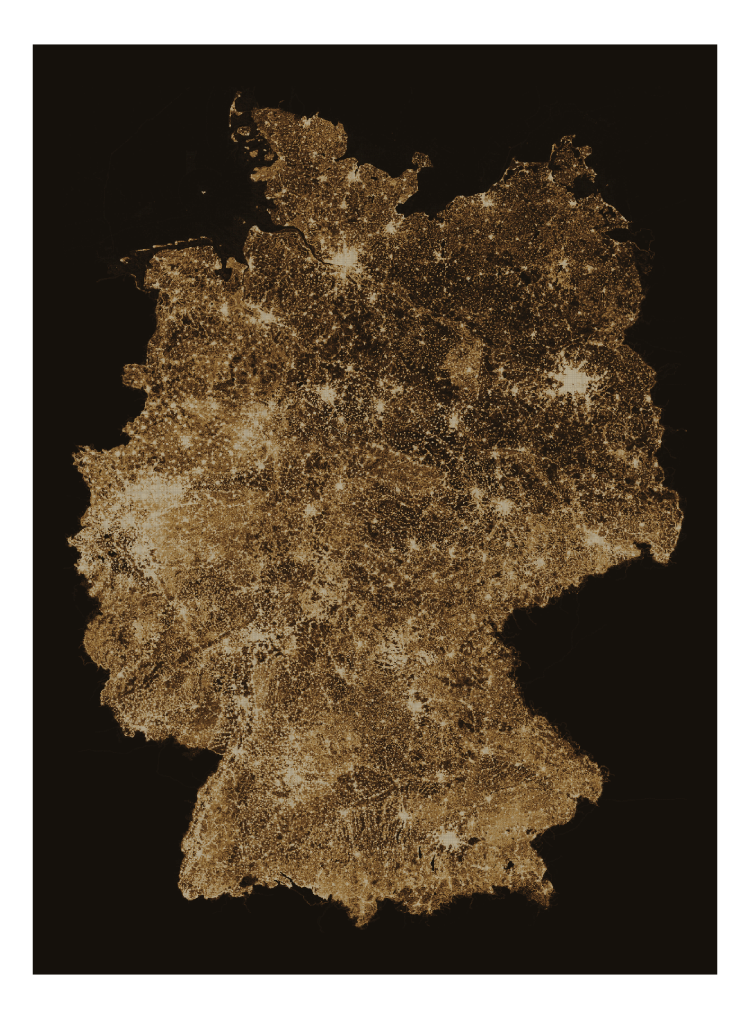
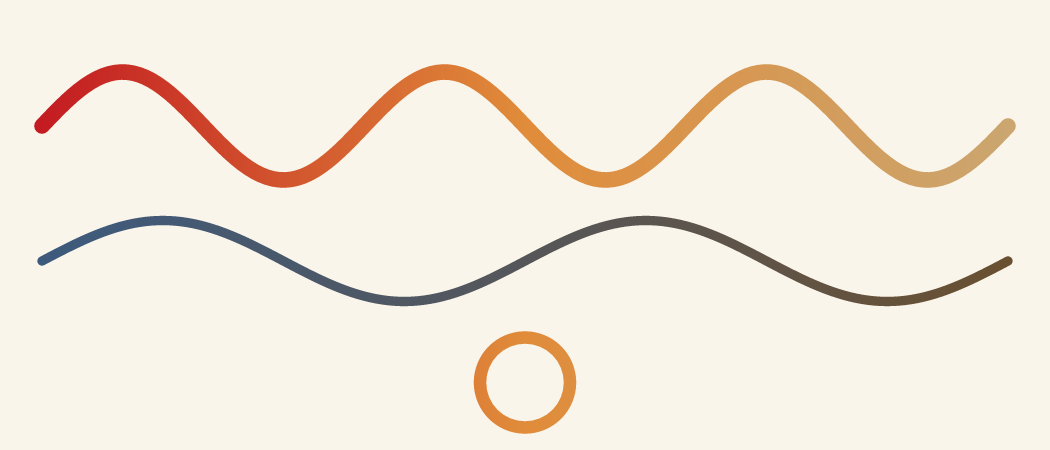
The tagged points of interest, then all 436 million nodes in the country, aggregated in DuckDB so they fit in memory. On a warm earth palette.

Hexagonal binning
Heatmaps

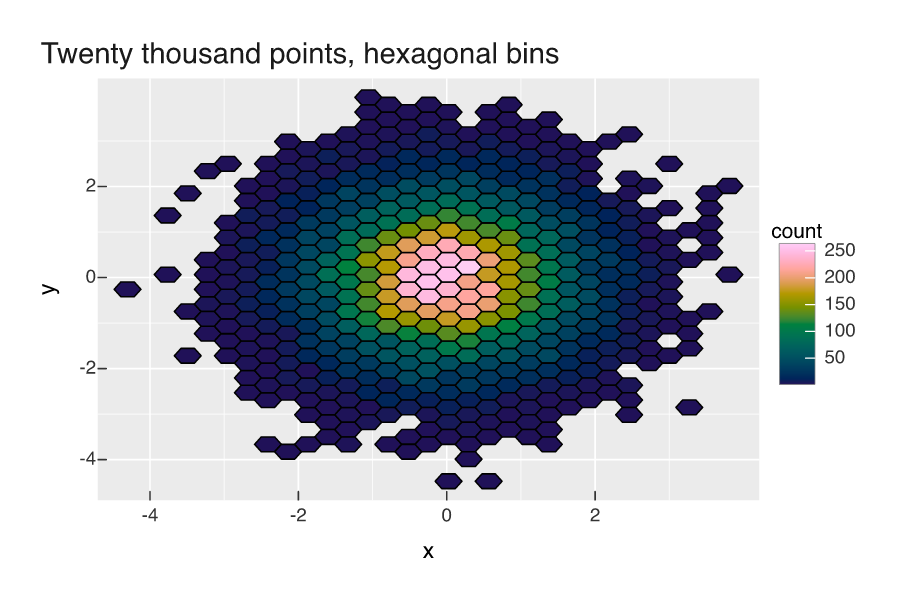
Twenty thousand points binned into hexagons, shaded by count with a perceptual palette.

Interactive widget
Interactive

Any vellumplot becomes a client-side interactive widget with as_widget(): hover, select, brush, and zoom.

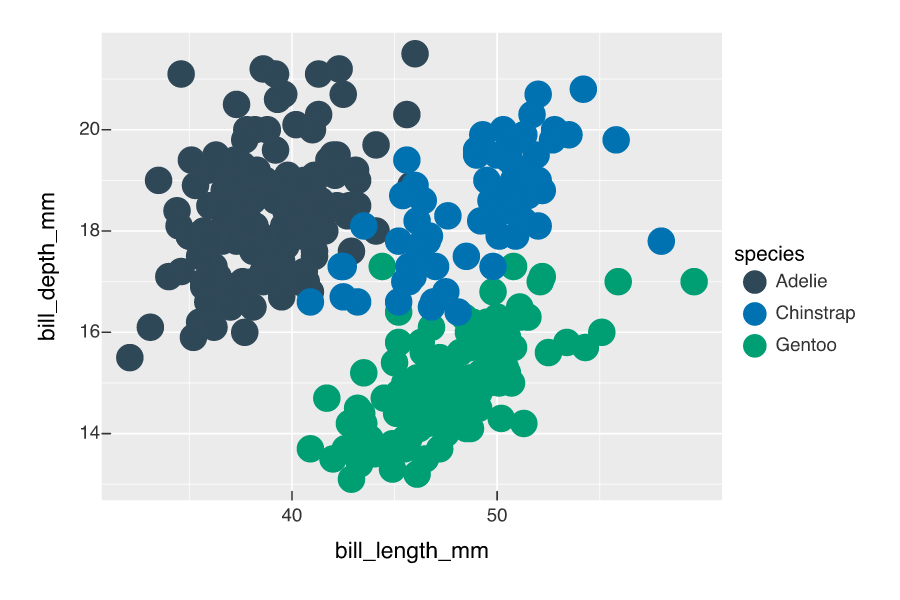
Layered marks: points and a smooth
Basics

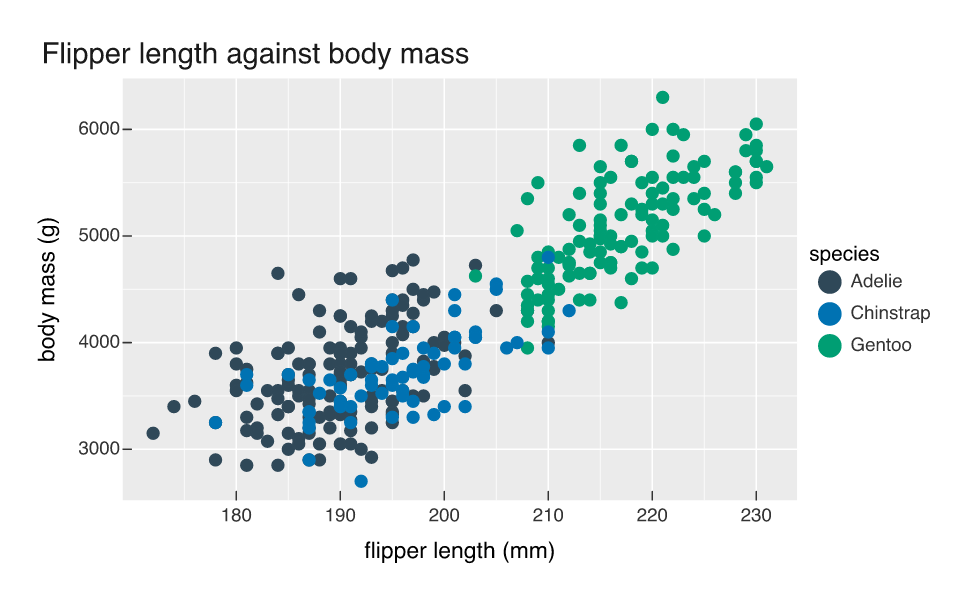
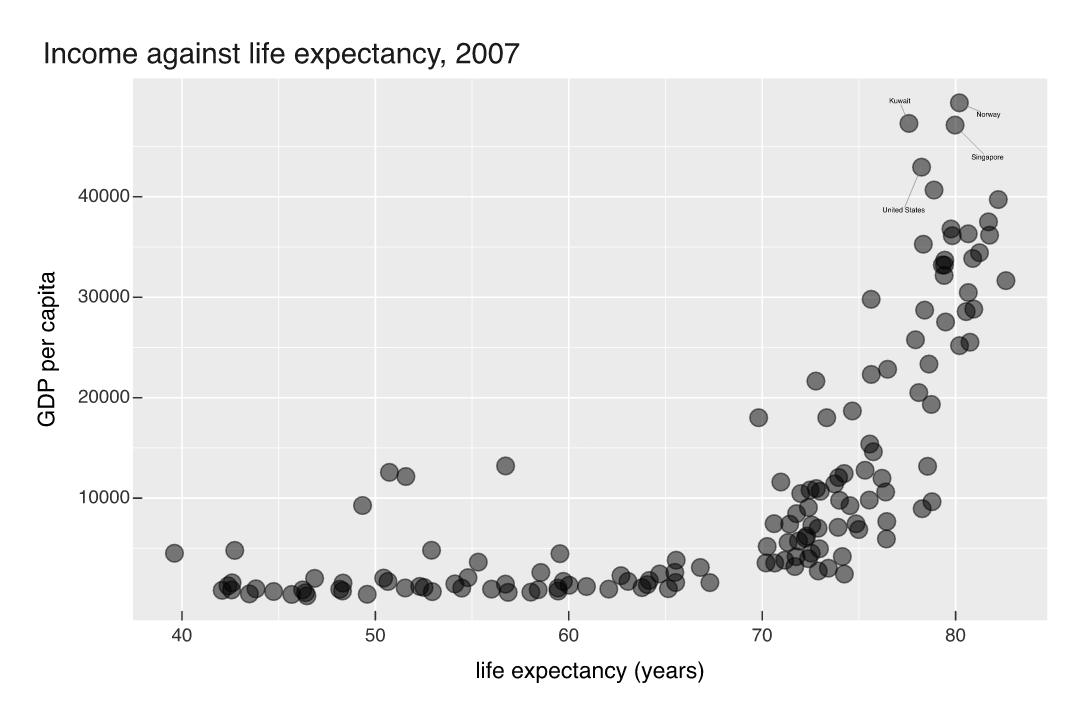
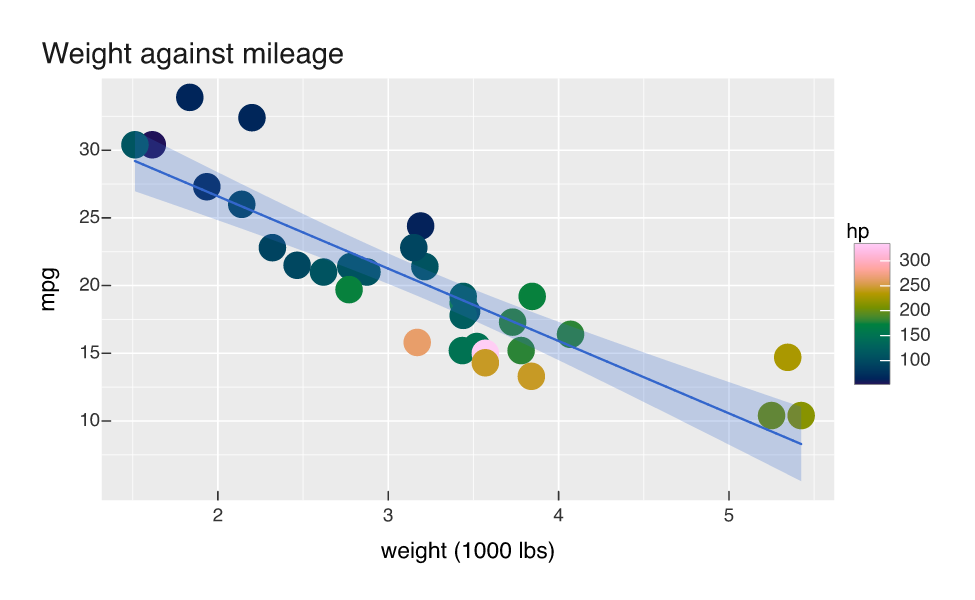
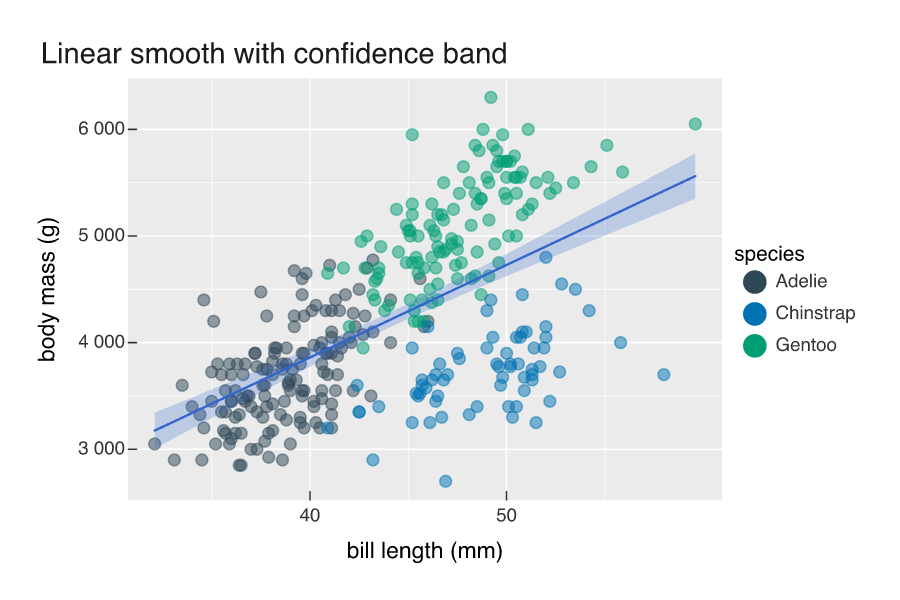
Two marks over the same data: a scatter and a linear smooth with a confidence band.

Lollipop chart
Basics

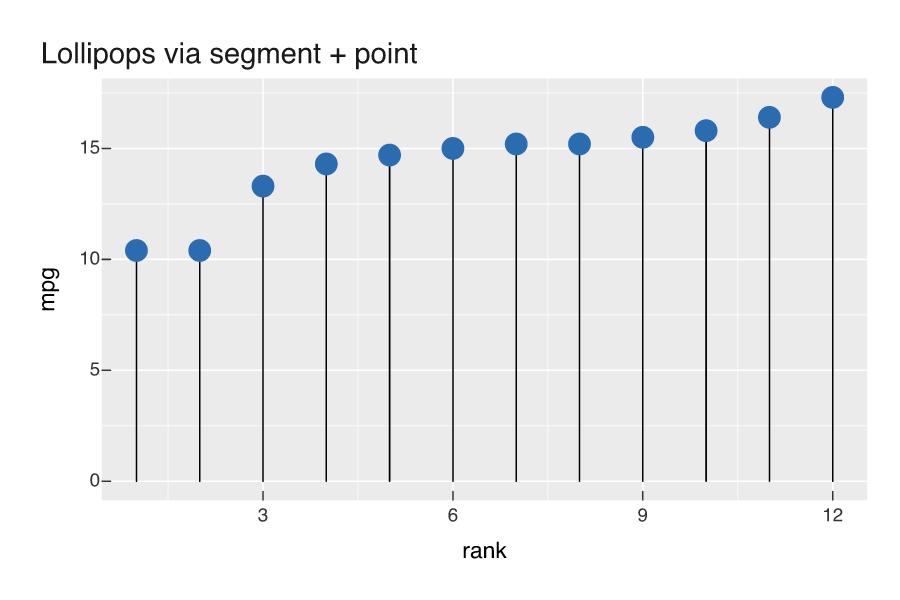
A lollipop built from primitives: a segment mark for the stems and a point mark for the heads.

Marginal distributions
Statistical

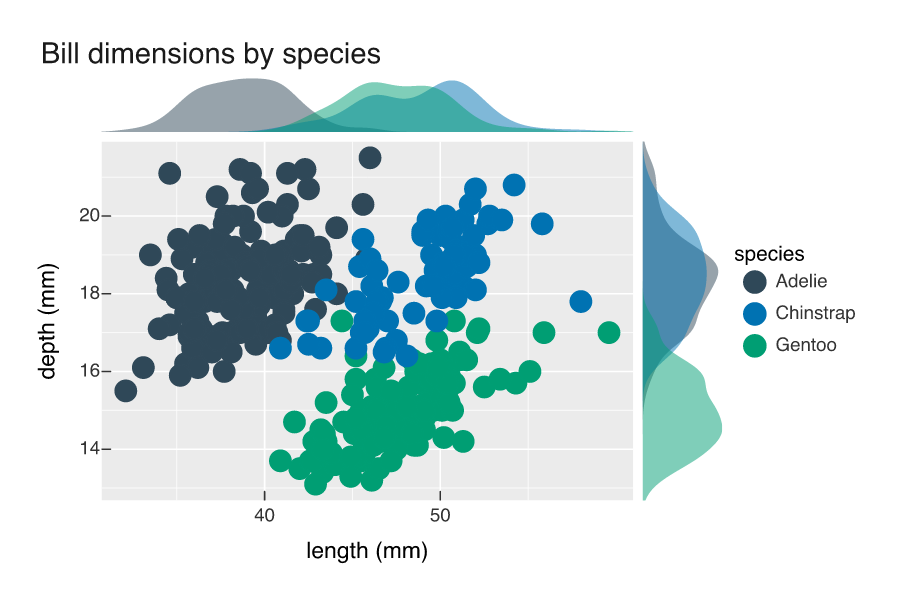
add_marginal() draws the x and y distributions along the panel edges, aligned to the scatter. Density or histogram, pooled or split by group.

Network diagram
Networks

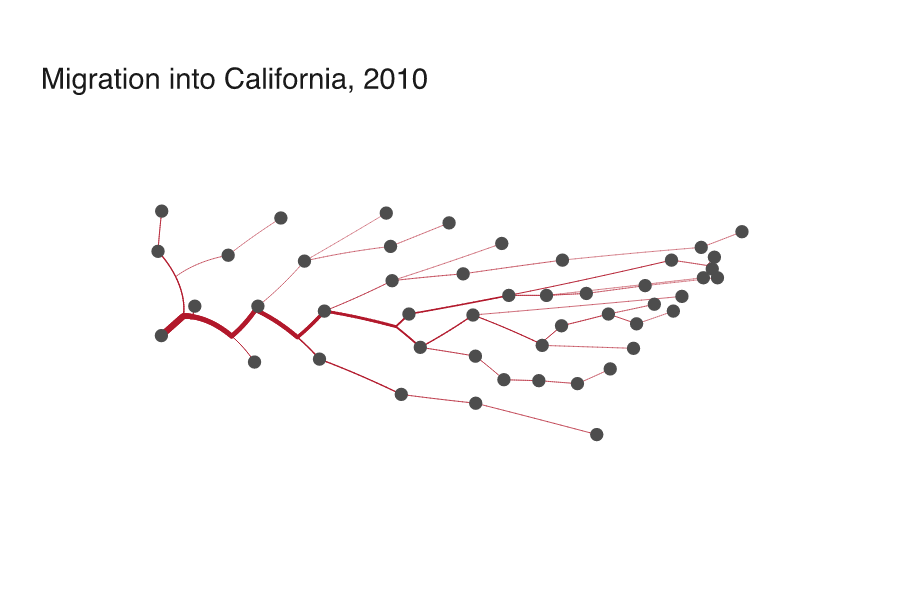
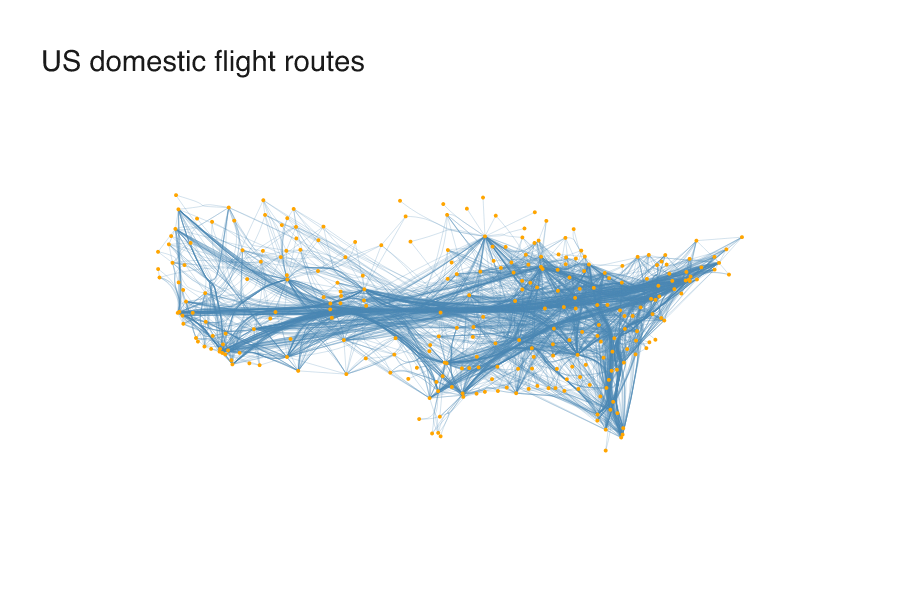
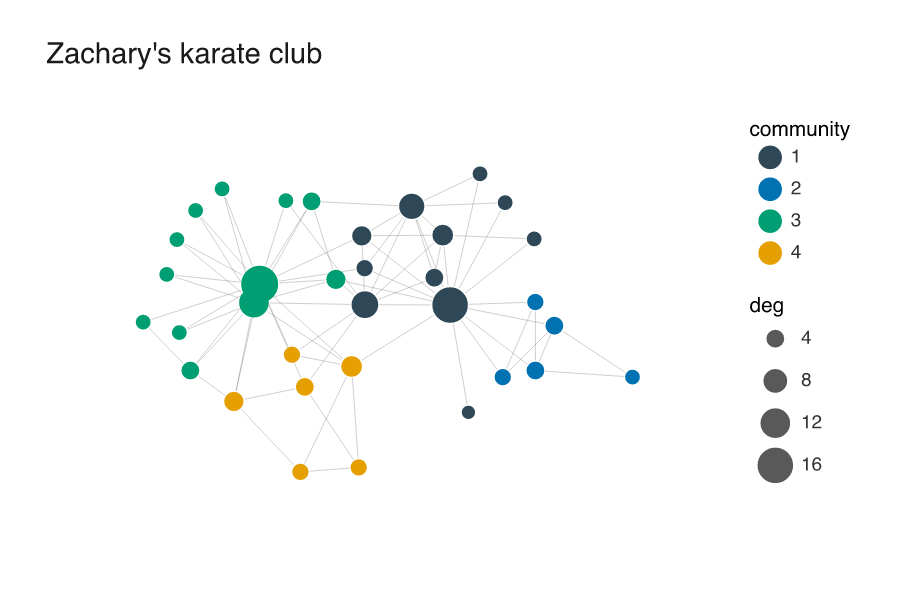
A node-link diagram from an igraph graph, laid out with a stress layout.

The paint model
Backend

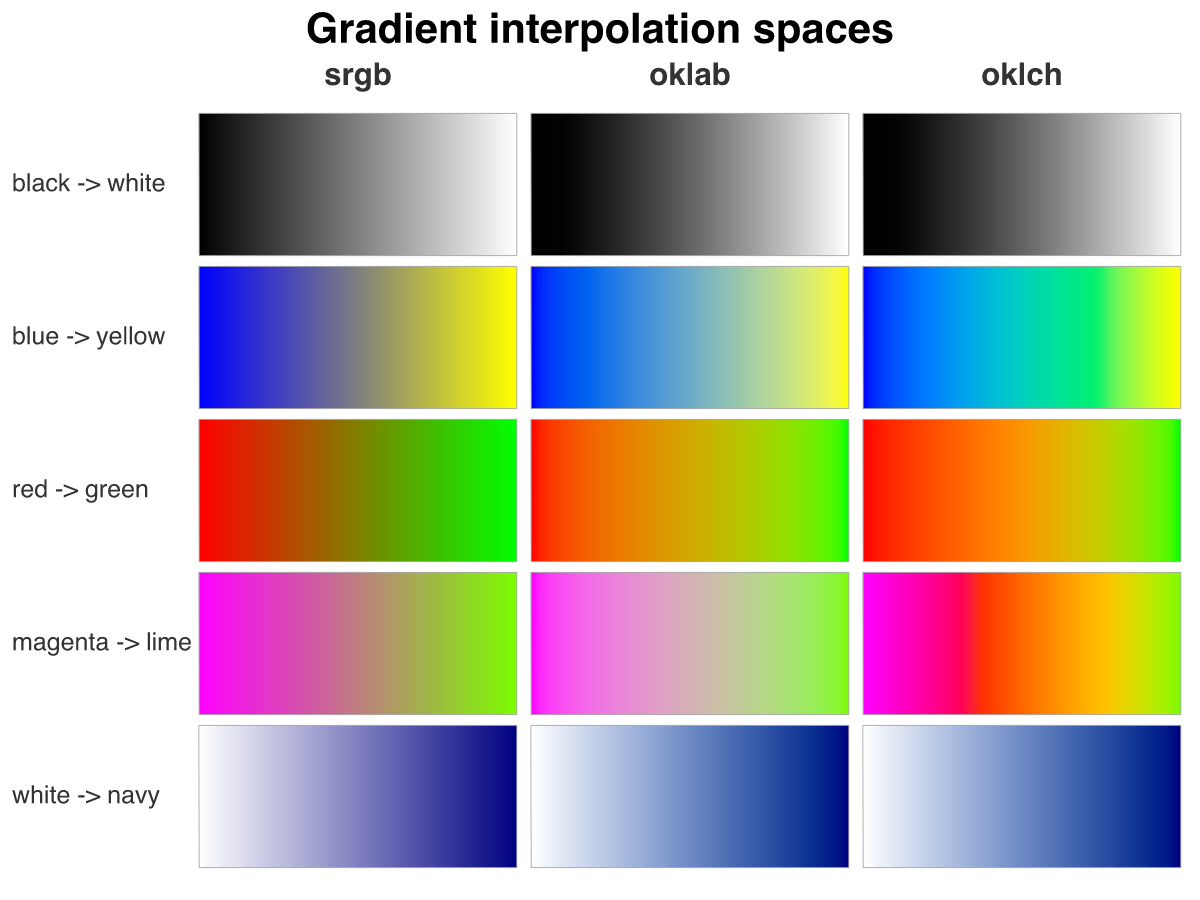
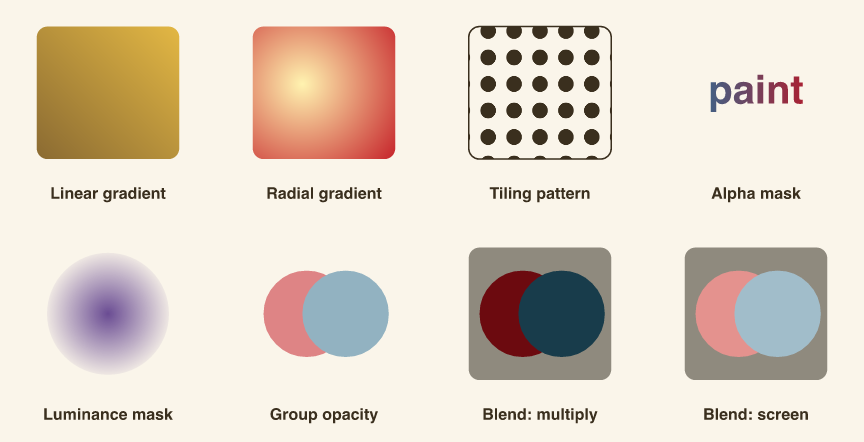
Gradients, tiling patterns, masks, group opacity, and blend modes, drawn straight from vellum grobs with no grammar in sight.

Paint model, meet the grammar
Backend
Statistical

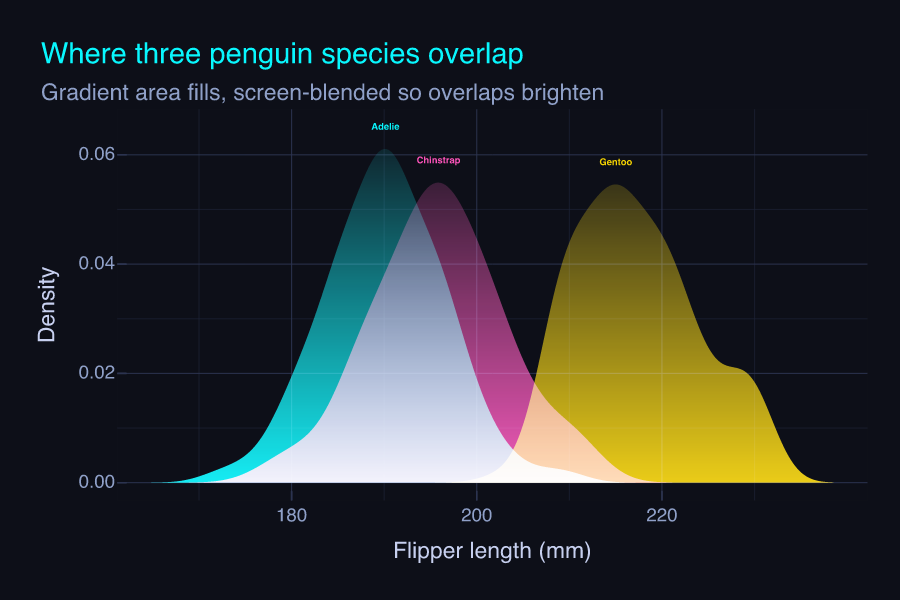
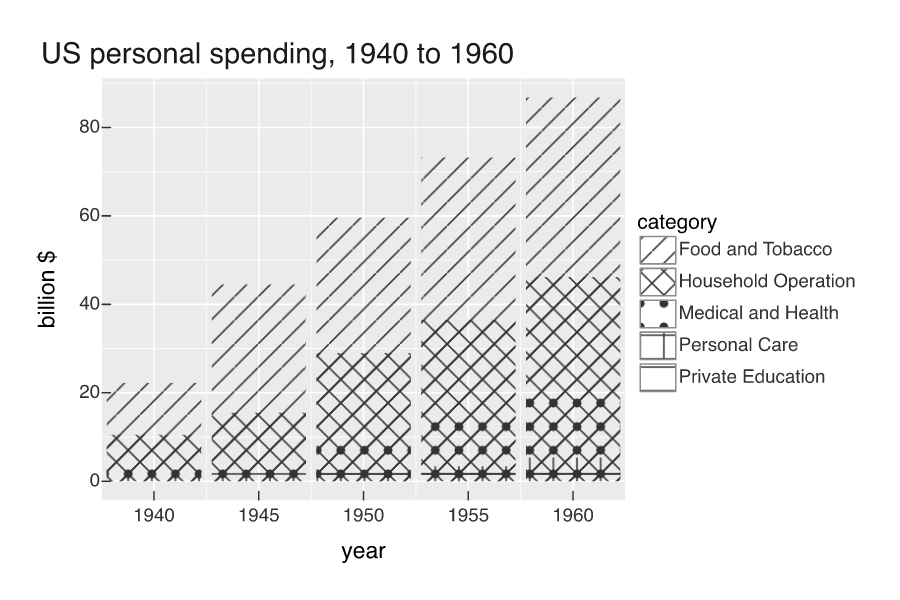
The same gradient fills and blend modes from the paint-model page, dropped straight into a vellumplot chart through mark aesthetics.

Pie and donut
Polar

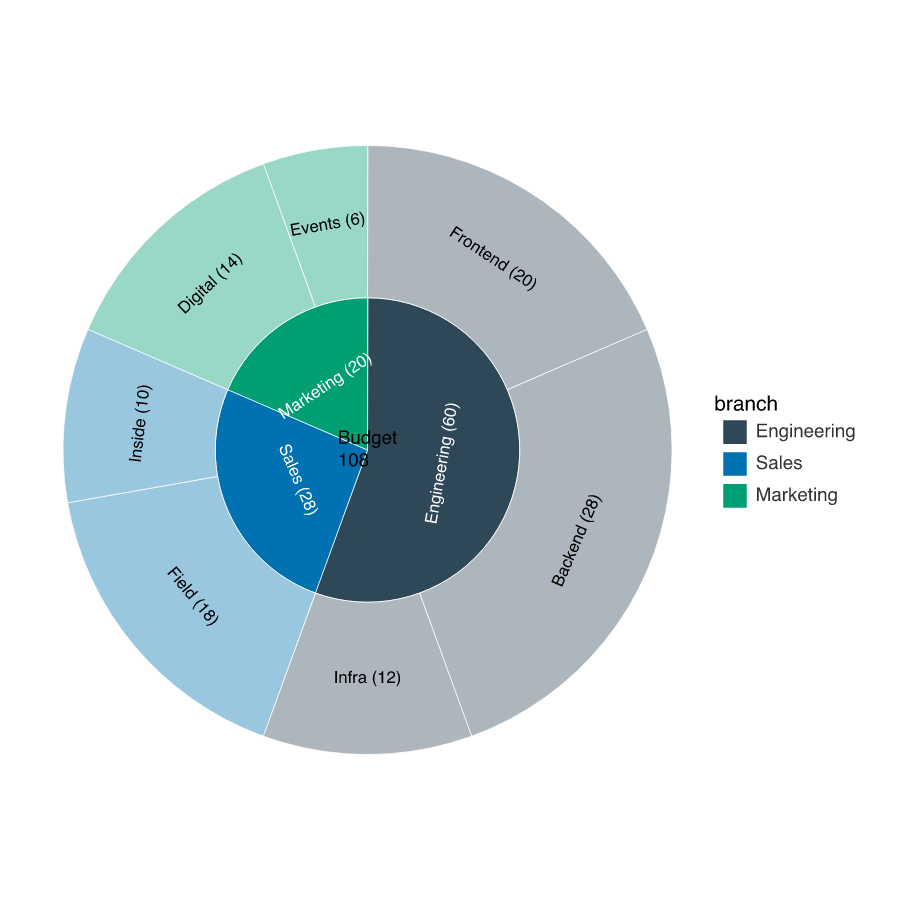
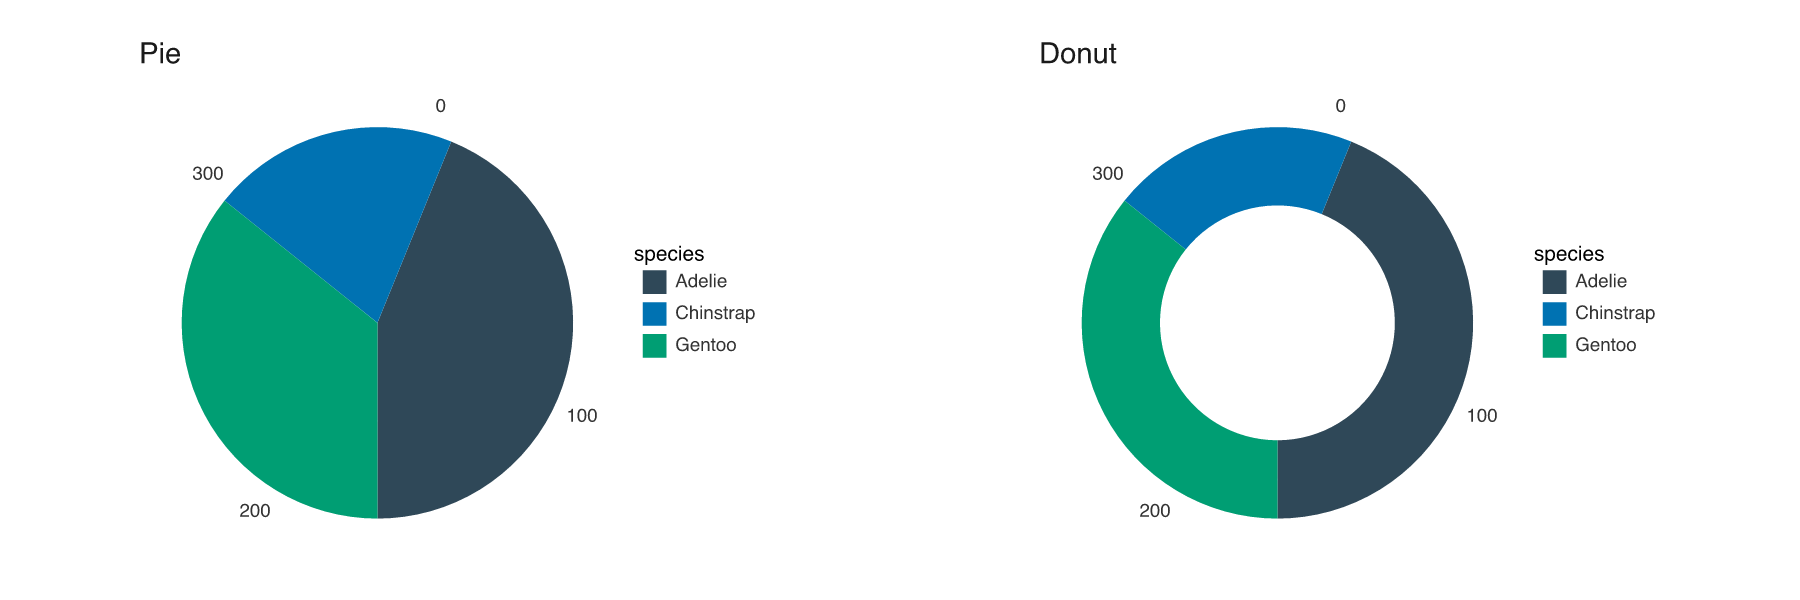
The same category counts as a pie and as a donut, with a configurable hole.

Rich text labels with md()
Text

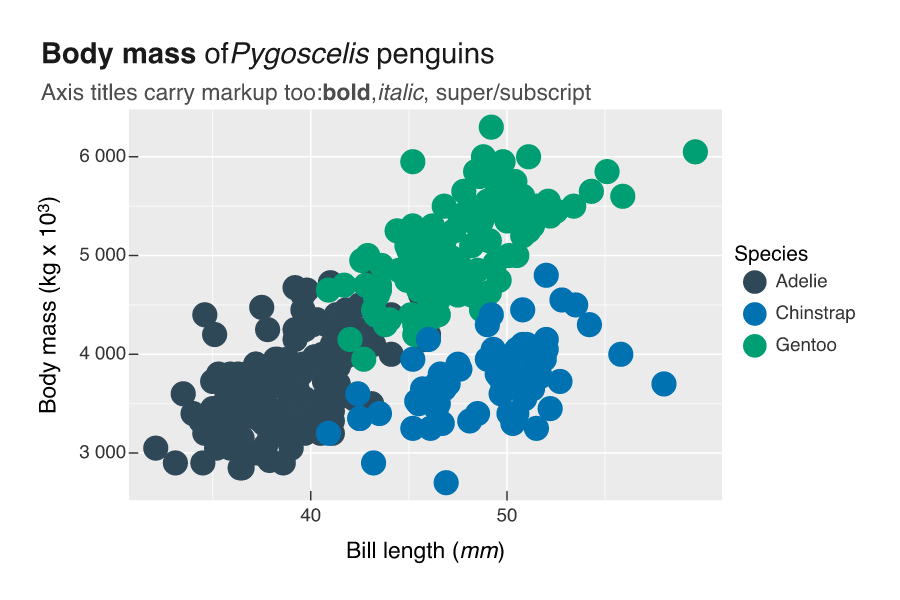
Markdown markup in titles and axis names: bold, italic, superscript, and subscript via md().

Scatter with a continuous colour legend
Basics


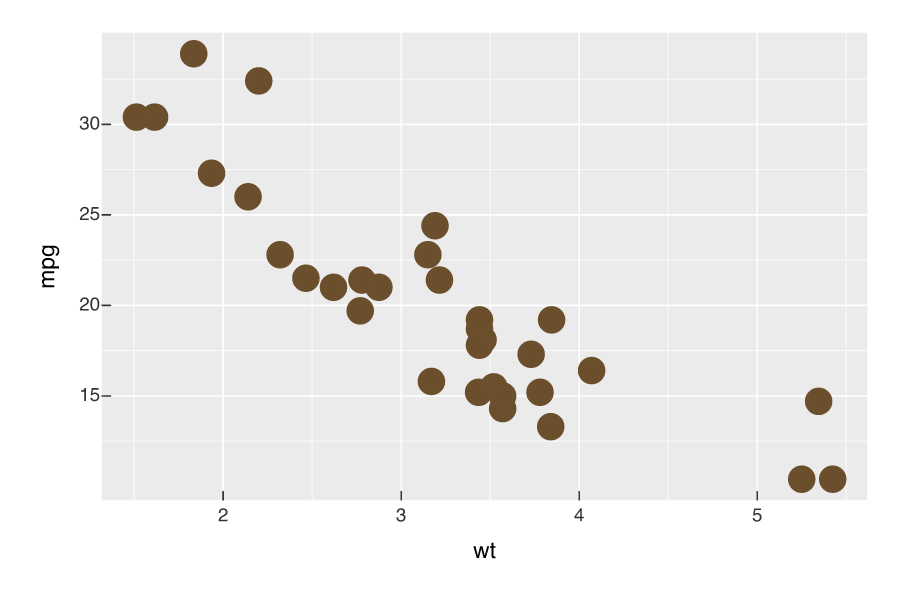
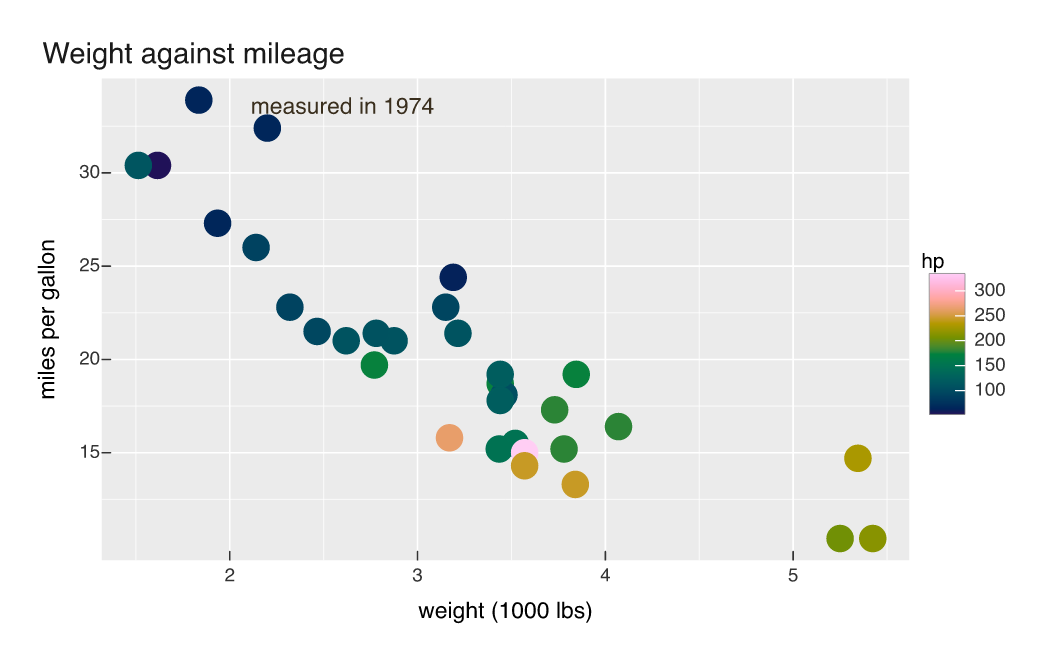
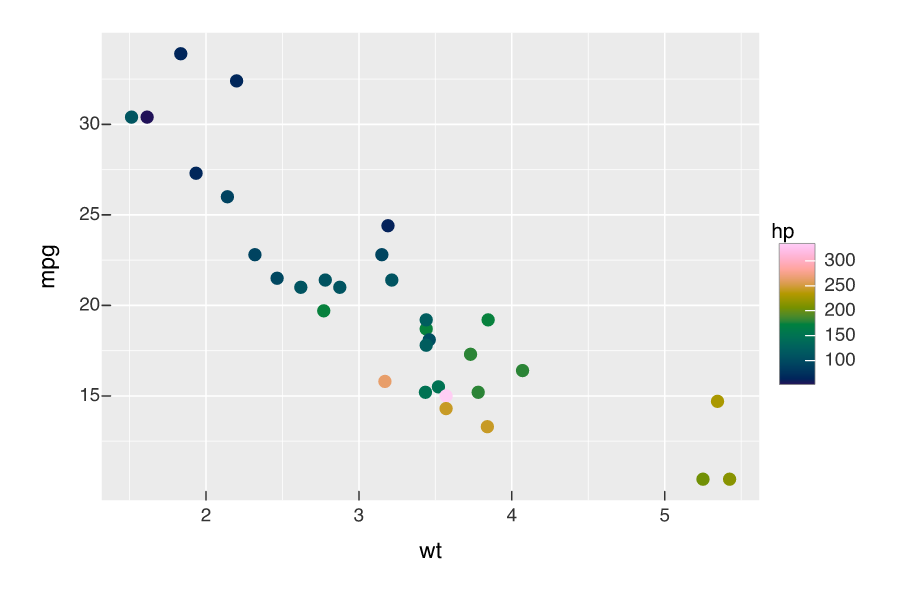
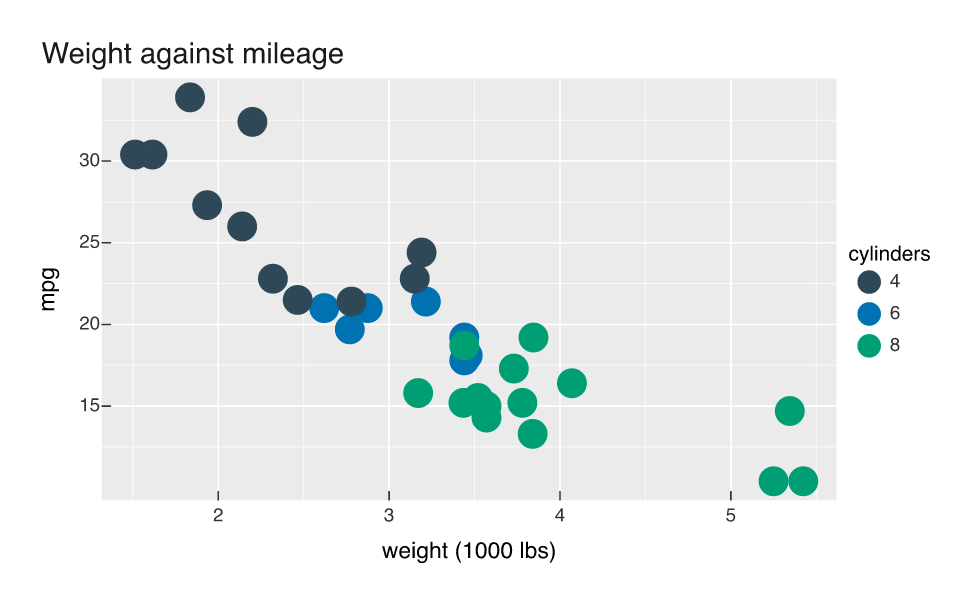
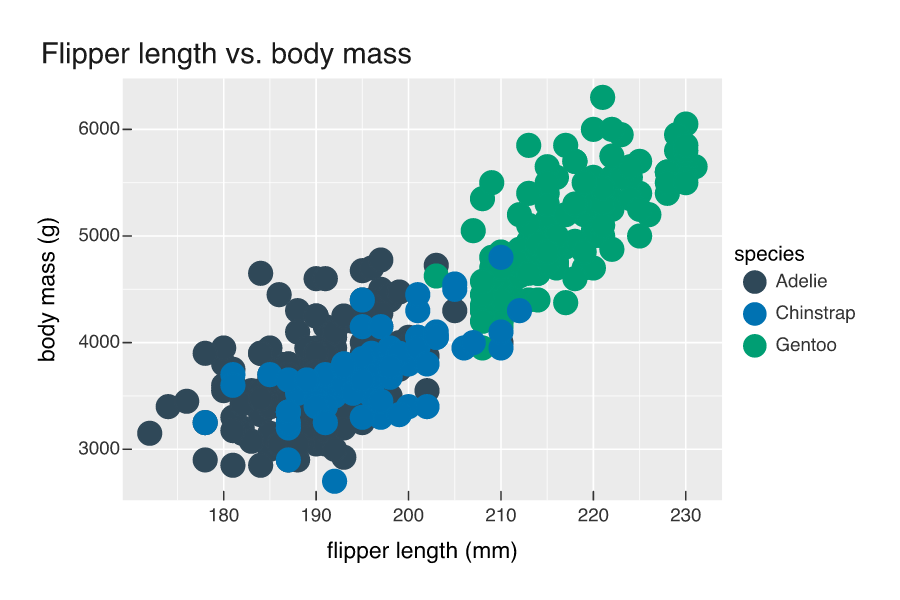
A point mark encoding a third variable to colour, with a trained continuous scale and guide.

Hand-drawn sketch style
Effects

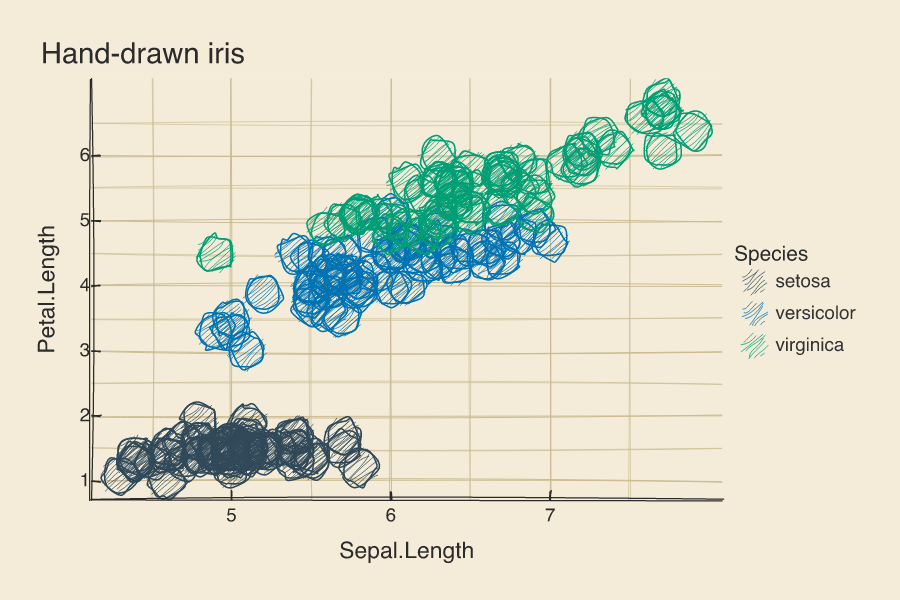
A Rough.js-style hand-drawn rendering, applied per mark or as a whole theme.

632 million map points, one continent
Spatial
Big data

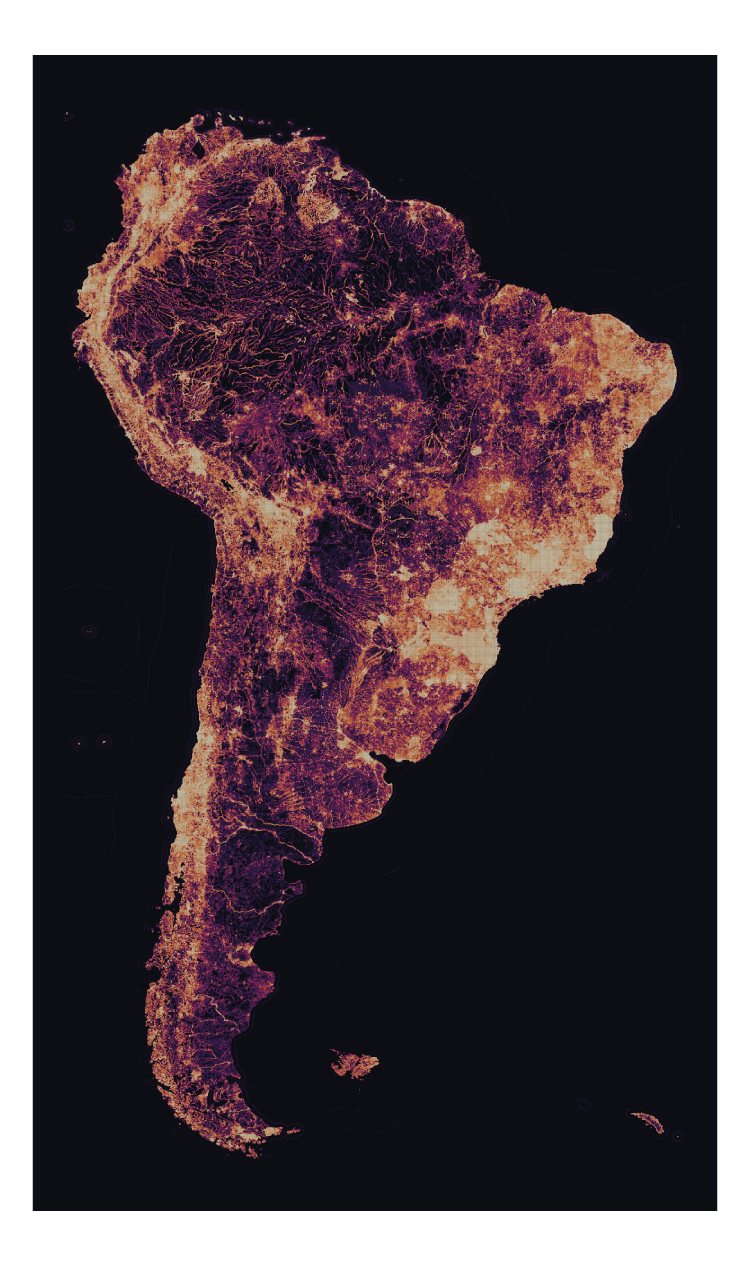
Every OpenStreetMap node in South America, datashaded. 632M points aggregated to 8.4M grid cells in DuckDB before R sees them, so the render fits in memory without losing…

Every point of interest in Switzerland
Spatial
Big data

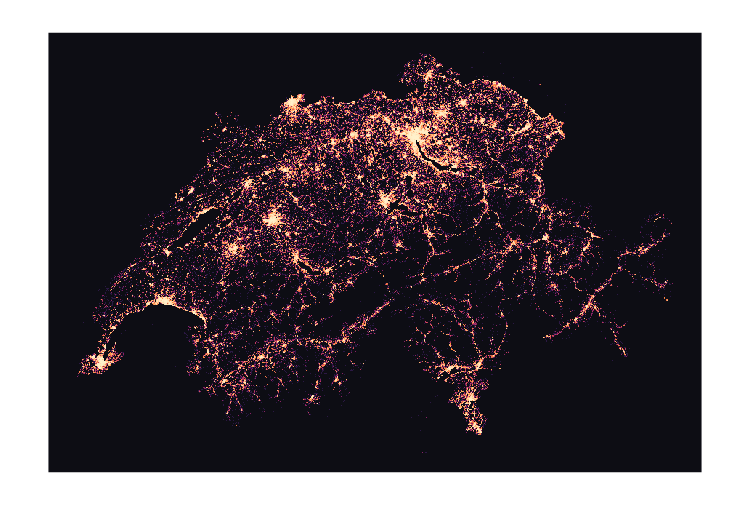
Half a million OpenStreetMap POIs, streamed straight from a 500 MB .osm.pbf with DuckDB and datashaded into the shape of the country.

One scene, three formats
Backend

The same vellum scene rendered to PNG, SVG, and PDF, with identical geometry from one Rust-backed backend.

No matching items
    Back to top

    Built with Quarto · part of the vellum ecosystem


    © 2026 · MIT licensed