Flags as image marks

Images
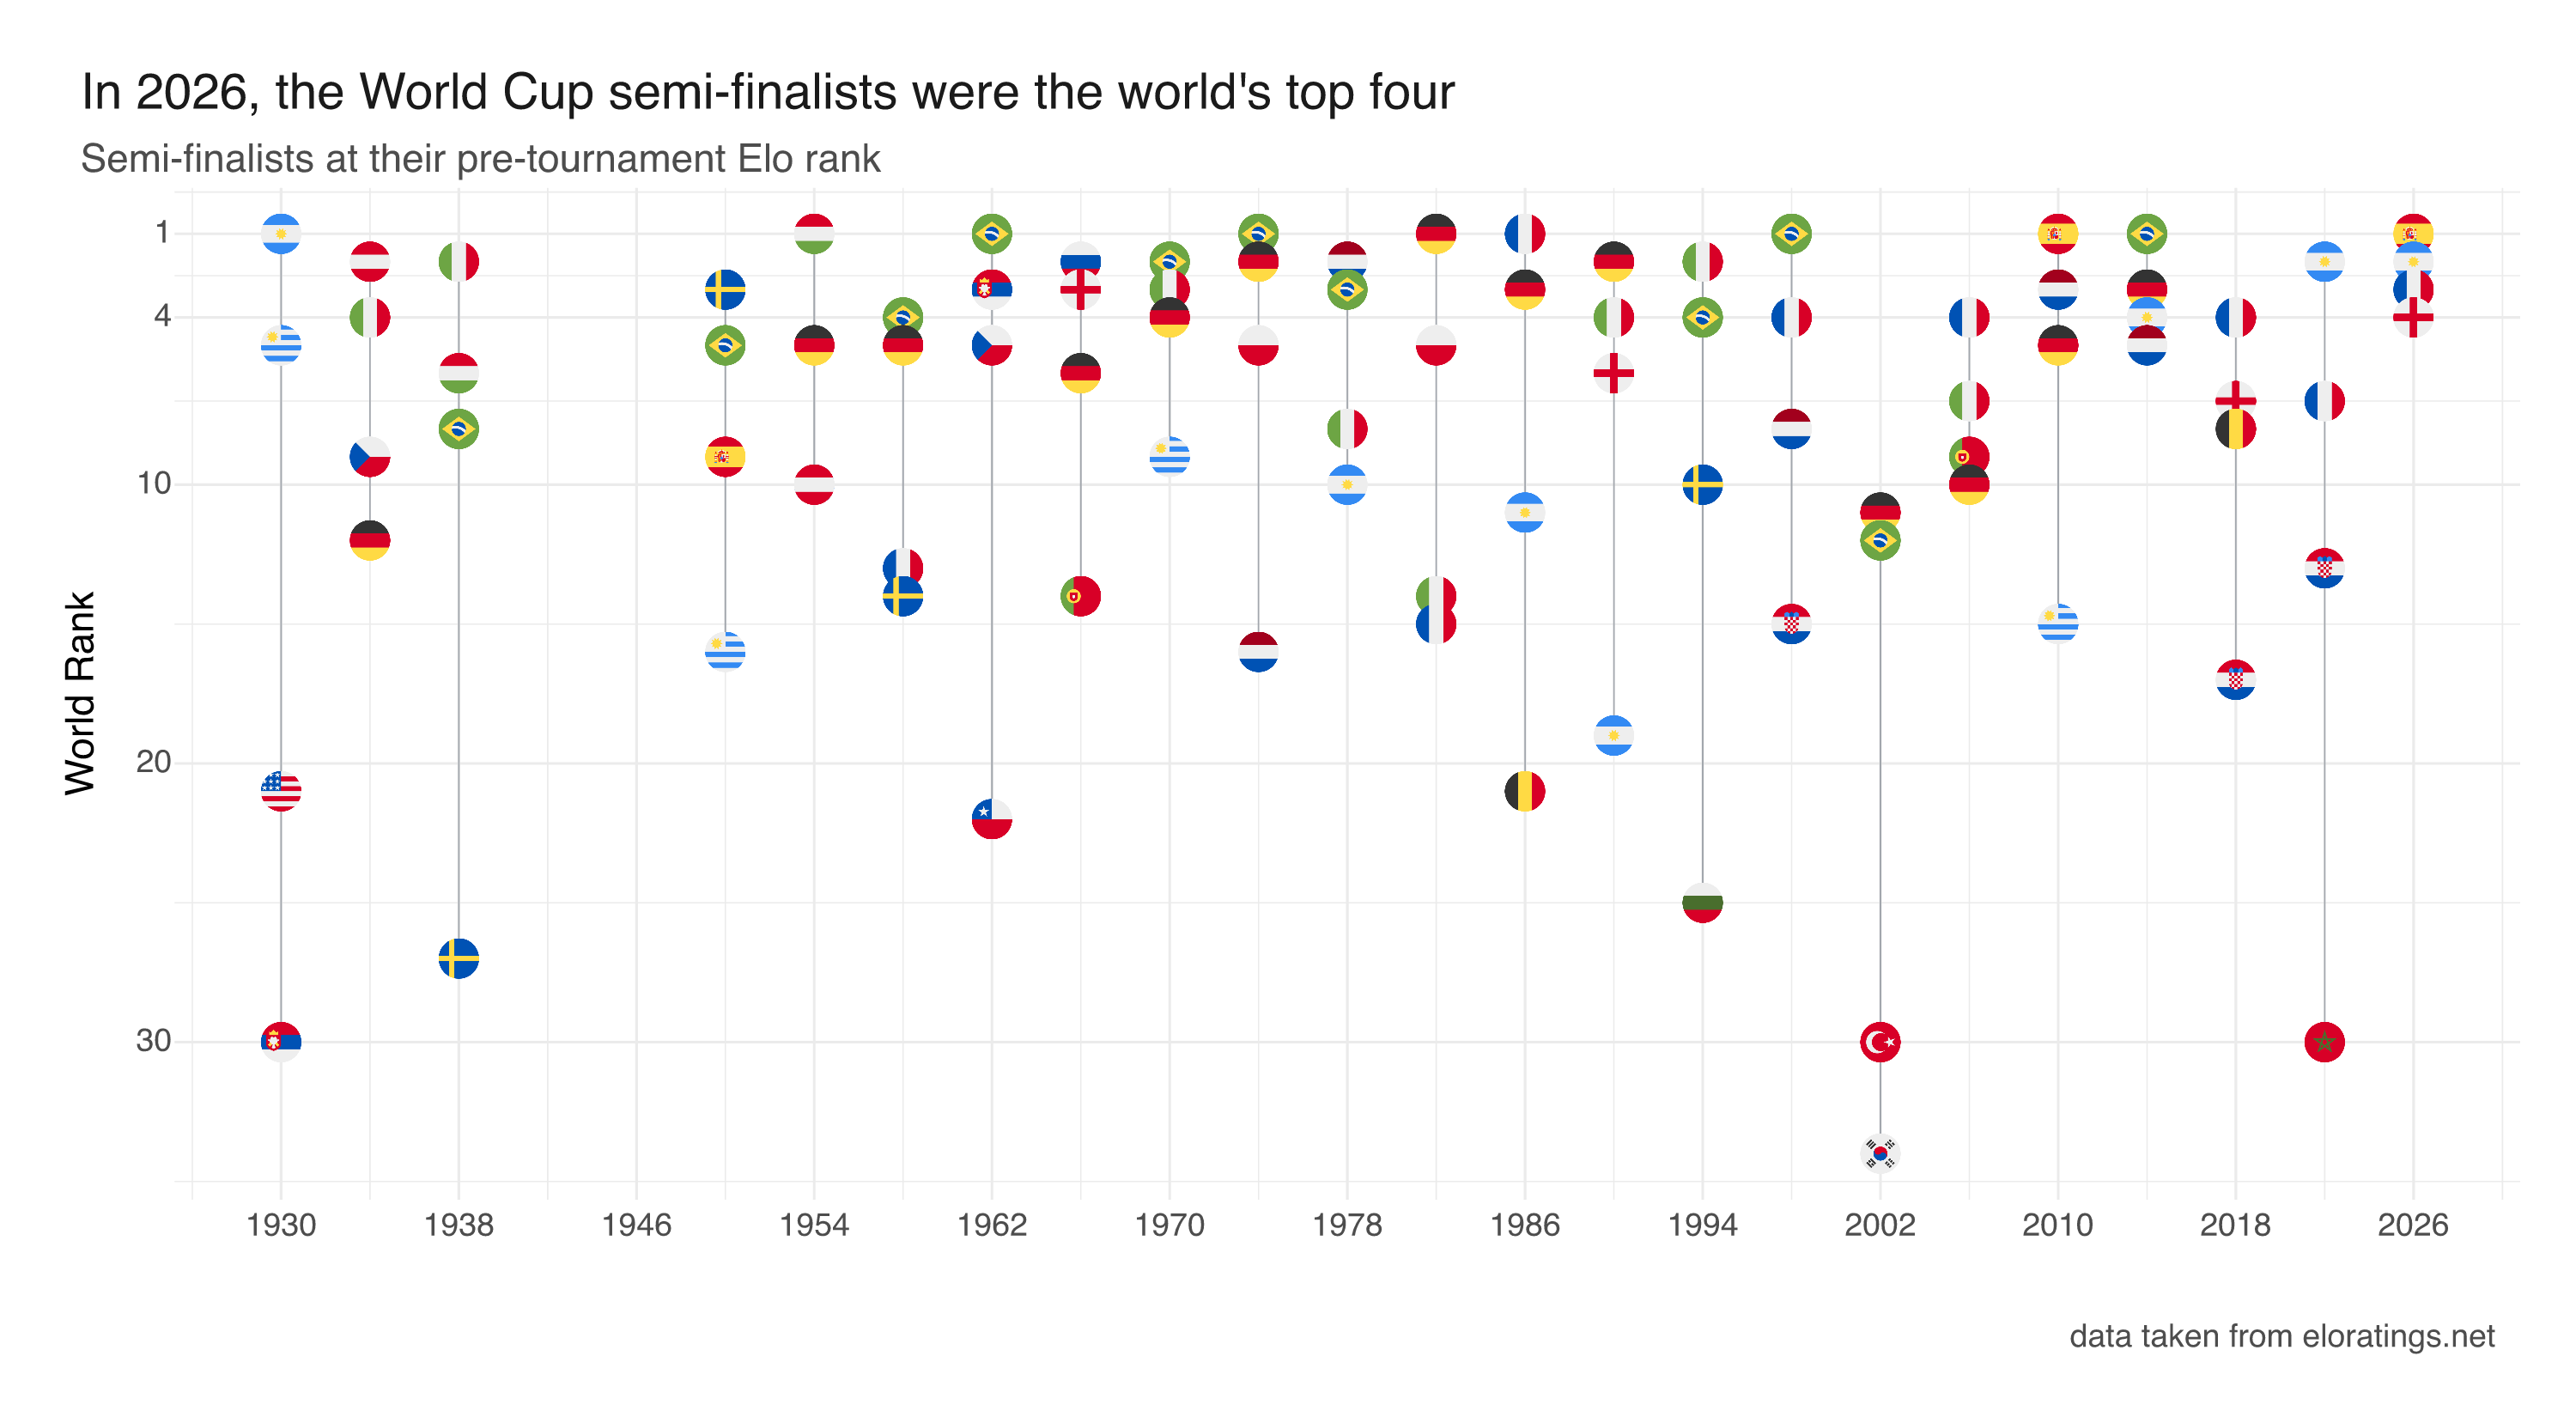
mark_image() places a raster at every data point. Here round country-flag PNGs mark each World Cup semi-finalist at its pre-tournament Elo rank, and 2026 stands out as the only edition whose semi-finalists were the world’s top four.

mark_image() draws a raster image at each (x, y) position instead of a point or a symbol. You map src to a column of file paths, set a size (the image height, in millimetres; the width follows from the image’s aspect ratio), and every row becomes a little picture on the panel. It is the natural mark when the category is the picture: logos, faces, icons, or, here, national flags.

The data is every World Cup semi-finalist from 1930 to 2026, placed at the world Elo rank it held on the eve of the tournament (rank 1 at the top). Each team is drawn as a round flag; a thin grey connector spans each tournament’s best- to worst-ranked semi-finalist. The story reads off the top of the chart: 2026 is the only edition where all four flags sit in the top four. The semi-finalists were the world’s four best teams going in.

Note

This example is not run when the site is built: it needs 25 round flag PNGs that are not committed to the repository. The image below is the real output, committed with the site; the code at the end is the exact source. See Getting the round flags for where to fetch them.

Chart with tournament year on the x-axis and world rank (1 at top) on the y-axis. Round national flags mark each semi-finalist, connected by a thin grey line per tournament. Most years have flags trailing down into the teens and twenties; 2026's four flags cluster at ranks one to four.

World Cup semi-finalists 1930–2026, each drawn as a round flag at its pre-tournament world Elo rank; only 2026 has all four in the top four.

Getting the round flags

The circular flags come from the circle-flags project (MIT-licensed). They are SVGs, one per country, served over jsDelivr:

https://cdn.jsdelivr.net/gh/HatScripts/circle-flags/flags/<iso2>.svg

where <iso2> is the lowercased ISO 3166-1 alpha-2 code (es, br, fr, …). The example expects a PNG per team, named by the code used in the data and placed in a flags/ folder next to the document, e.g. flags/ES.png, flags/BR.png. Those codes are the uppercased alpha-2 codes, with one exception: England is gb-eng (there is no ISO country for it).

Rasterise with a mask-aware SVG renderer so the circular clip is honoured. librsvg’s rsvg-convert or the R rsvg package both work:

rsvg-convert -w 200 -h 200 es.svg -o flags/ES.png

ImageMagick’s built-in SVG reader ignores the mask and renders the flags as squares, so avoid it for this.

The code

The data: 92 semi-finalists (year, pre-tournament world rank, team code)
sf <- read.csv(text = "world_cup,world_rank,code
1930,1,AR
1930,5,UY
1930,21,US
1930,30,RS
1934,2,AT
1934,4,IT
1934,9,CZ
1934,12,DE
1938,2,IT
1938,6,HU
1938,8,BR
1938,27,SE
1950,3,SE
1950,5,BR
1950,9,ES
1950,16,UY
1954,1,HU
1954,5,DE
1954,10,UY
1954,10,AT
1958,4,BR
1958,5,DE
1958,13,FR
1958,14,SE
1962,1,BR
1962,3,RS
1962,5,CZ
1962,22,CL
1966,2,RU
1966,3,EN
1966,6,DE
1966,14,PT
1970,2,BR
1970,3,IT
1970,4,DE
1970,9,UY
1974,1,BR
1974,2,DE
1974,5,PL
1974,16,NL
1978,2,NL
1978,3,BR
1978,8,IT
1978,10,AR
1982,1,DE
1982,5,PL
1982,14,IT
1982,15,FR
1986,1,FR
1986,3,DE
1986,11,AR
1986,21,BE
1990,2,DE
1990,4,IT
1990,6,EN
1990,19,AR
1994,2,IT
1994,4,BR
1994,10,SE
1994,25,BG
1998,1,BR
1998,4,FR
1998,8,NL
1998,15,HR
2002,11,DE
2002,12,BR
2002,30,TR
2002,34,KR
2006,4,FR
2006,7,IT
2006,9,PT
2006,10,DE
2010,1,ES
2010,3,NL
2010,5,DE
2010,15,UY
2014,1,BR
2014,3,DE
2014,4,AR
2014,5,NL
2018,4,FR
2018,7,EN
2018,8,BE
2018,17,HR
2022,2,AR
2022,7,FR
2022,13,HR
2022,30,MA
2026,1,ES
2026,2,AR
2026,3,FR
2026,4,EN")
library(vellumplot)

# round flag PNG for each team (see "Getting the round flags" above)
sf$flag <- file.path("flags", paste0(sf$code, ".png"))

# one vertical connector per tournament: best-ranked to worst-ranked semi-finalist
span <- do.call(rbind, lapply(split(sf, sf$world_cup), function(d) {
  data.frame(year = d$world_cup[1], best = min(d$world_rank), worst = max(d$world_rank))
}))

vplot(sf, width = 10, height = 5.5, dpi = 300) |>
  mark_segment(
    x = year, xend = year, y = best, yend = worst, data = span,
    color = "#9aa0a6", linewidth = 0.6, alpha = 0.9
  ) |>
  mark_image(x = world_cup, y = world_rank, src = flag, size = 4) |>
  scale_y_continuous(trans = "reverse", breaks = c(1, 4, 10, 20, 30), name = "World Rank") |>
  scale_x_continuous(breaks = seq(1930, 2026, by = 8), name = "") |>
  theme_minimal() |>
  theme(legend.position = "none") |>
  labs(
    title = "In 2026, the World Cup semi-finalists were the world's top four",
    subtitle = "Semi-finalists at their pre-tournament Elo rank",
    caption = "data: eloratings.net"
  ) |>
  render_plot("worldcup-flags.png")
Back to top