cw <- aggregate(weight ~ Time + Diet, data = ChickWeight, FUN = mean)
cw$label <- paste("Diet", cw$Diet)
cw <- cw[order(cw$Diet, cw$Time), ]

p <- vplot(cw, width = 7, height = 4.6) |>
  mark_line(x = Time, y = weight, color = Diet, linewidth = 1.1) |>
  mark_text_path(
    x = Time, y = weight, label = label, color = Diet,
    size = 11, hjust = "right", offset = 7
  ) |>
  guides(color = "none") |>
  labs(
    title = "Four diets, labelled where they run",
    x = "days since hatching", y = "mean weight (g)"
)Labels that follow the curve
Text
mark_text_path() sets one label per group along that group’s own path, each glyph rotated to the local tangent: direct labelling instead of a legend.
A legend asks the reader to hold four colours in their head and look back and forth. Writing the name on the line does not. The obstacle has always been that a line is not horizontal, so an axis-aligned label either crosses it at an angle or sits awkwardly beside it.
mark_text_path() puts the glyphs on the path. It takes the group’s x/y points, walks them in data order, and rotates each glyph to the local tangent, the same idea as SVG’s textPath except that the layout is solved in the engine, so it works identically in PNG, SVG, and PDF.
Mean chick weight by diet, from datasets::ChickWeight, with each diet named on its own curve and no legend at all.
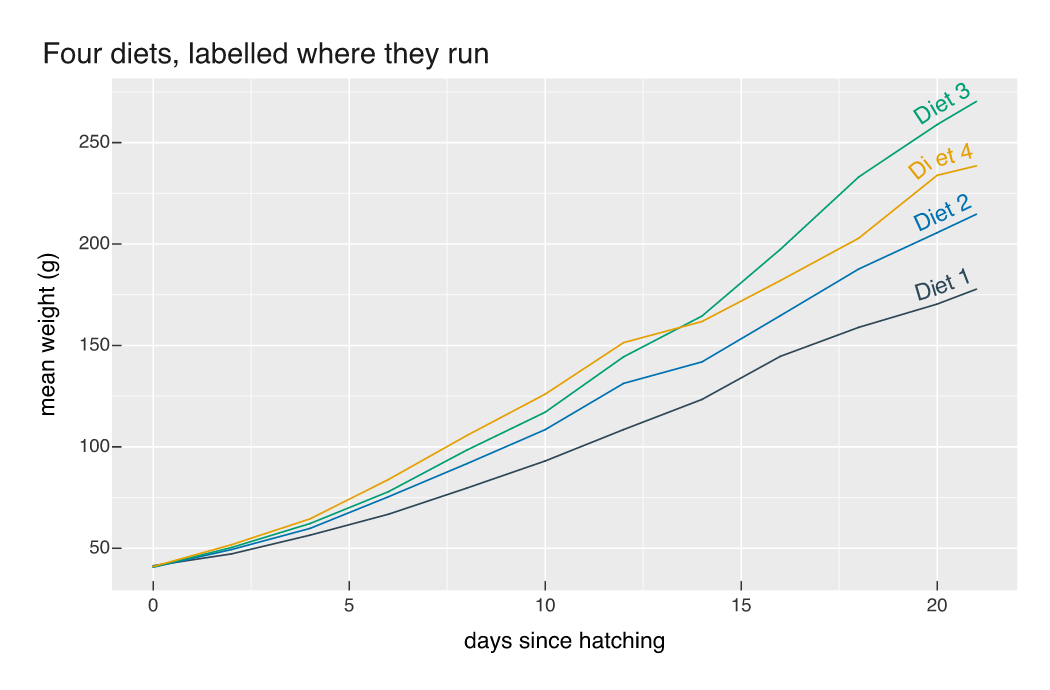
hjust slides the run along the path: "left" starts it at the first point, "right" ends it at the last, "centre" centres it. offset lifts it off the baseline in points, positive being to the left of travel. Here the labels are pushed to the end of each curve and raised clear of the line.
Which way the path runs matters
Glyphs follow the tangent, so a path walked right-to-left sets its label upside-down. Sort the path in the direction you want the text to read.
t_up <- seq(pi, 0, length.out = 80)      # left to right along the top
arc <- data.frame(
  x = c(cos(t_up), cos(t_up)),         # both halves run x = -1 to x = 1
  y = c(sin(t_up), -sin(t_up)),
  side = rep(c("over the top", "and along the bottom"), each = 80)
)

# Traced with segments between consecutive points, because a line mark sorts by
# x and would not know which way round the circle to go.
seg <- do.call(rbind, lapply(split(arc, arc$side), function(d) {
  n <- nrow(d)
  data.frame(x = d$x[-n], y = d$y[-n], xend = d$x[-1], yend = d$y[-1], side = d$side[-n])
}))

p2 <- vplot(arc, width = 6, height = 5) |>
  mark_segment(x = x, y = y, xend = xend, yend = yend, color = side,
               linewidth = 0.8, data = seg) |>
  mark_text_path(x = x, y = y, label = side, color = side, size = 14, offset = 6) |>
  guides(color = "none") |>
  labs(title = "Both halves traversed left to right", x = NULL, y = NULL) |>
  theme_minimal()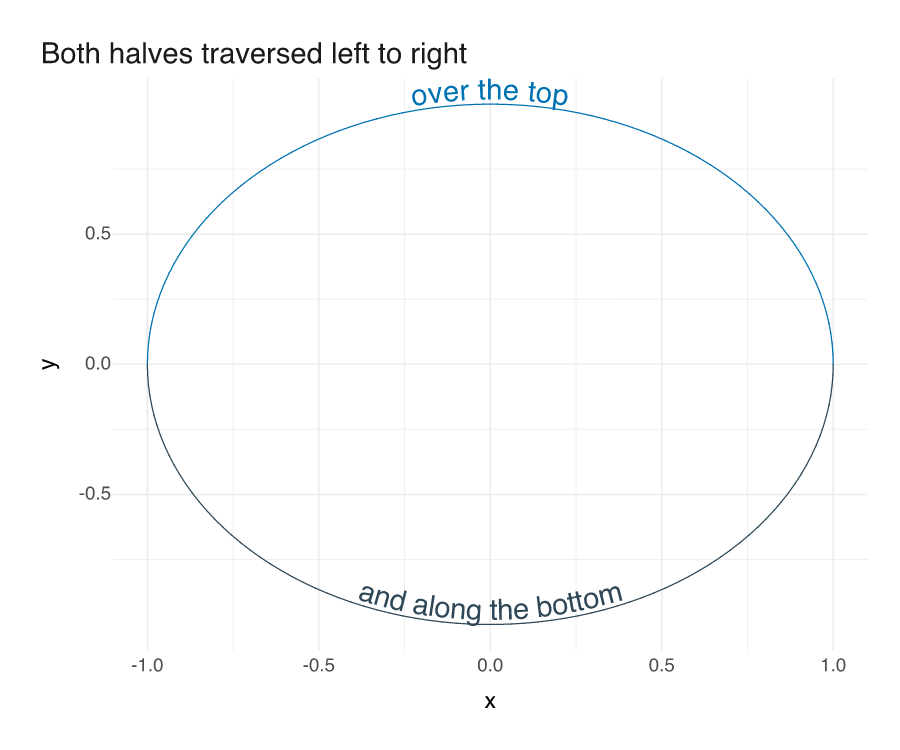
Each half of the circle is stored in the order it should be read, so both labels come out upright even though one rides the top and the other the bottom. Reverse either half and its text turns over.
The output is real, selectable <text> in SVG rather than glyph outlines, so the label is still searchable and copyable in a browser. One label is drawn per group, taken from the group’s first row, and groups split the usual way: a discrete color, or a distinct label, starts a new run.