members <- list(
  Coffee = c("Ann", "Bo", "Cy", "Di", "Ed", "Fi", "Gus"),
  Tea    = c("Bo", "Di", "Hal", "Ivy", "Jo"),
  Cocoa  = c("Cy", "Di", "Ivy", "Kit", "Lou", "Max")
)

p <- vvenn(members, width = 6, height = 5)Venn diagrams that are not transparency tricks
Statistical
vvenn() computes the disjoint regions of 2 or 3 sets as real geometry with boolean path operations, so the overlaps are solid fills instead of alpha-composited circles.
The usual way to draw a Venn diagram is to stack semi-transparent circles and let the overlaps darken. It looks fine on screen and then betrays you: the region colours are whatever alpha compositing produced rather than anything you chose, a region cannot be labelled by its own fill, and in PDF the transparency is either flattened to pixels or rendered differently by every viewer.
vvenn() computes the regions instead. The engine’s boolean path operations (vellum::vl_path_op()) intersect and subtract the circles to get each disjoint region as its own closed path, and that path is filled solid. Nothing overlaps, so nothing composites.
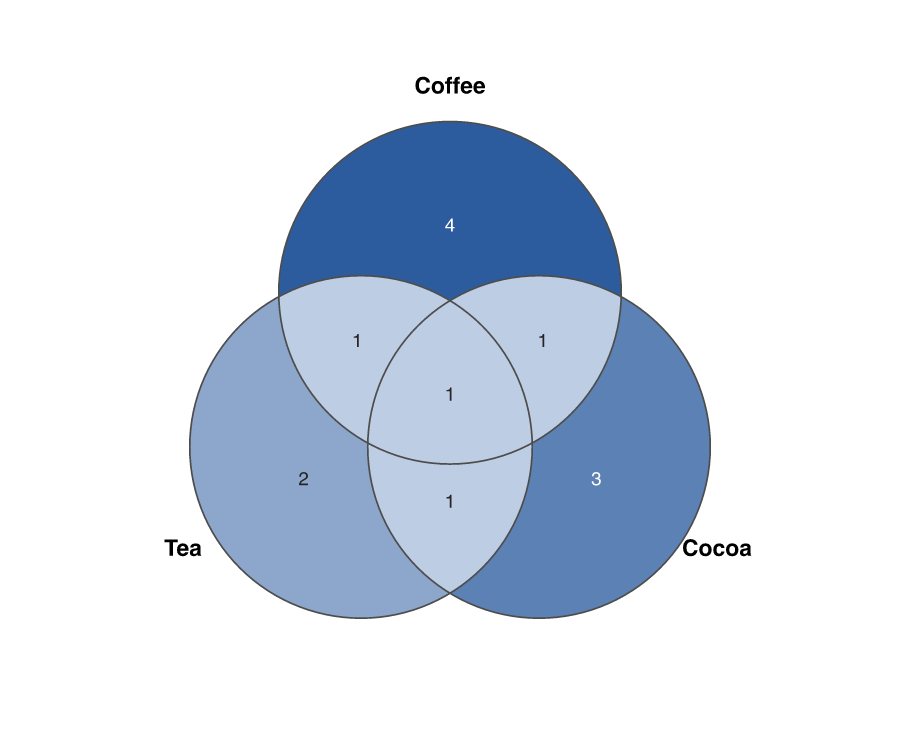
Each region is labelled with how many elements fall in exactly that combination of sets. Di is the only person in all three, so the centre reads 1 and the pairwise regions do not count them again. A transparency stack cannot show you that arithmetic, because the darkest patch in the middle still has no number attached to it.
Two sets, and a data frame instead of lists
With two sets you get the same treatment. If membership is already a table of logical columns, one per set, which is how it usually comes out of a join or a %in%, pass the data frame directly.
people <- unique(unlist(members))
membership <- data.frame(
  Coffee = people %in% members$Coffee,
  Tea    = people %in% members$Tea
)

p2 <- vvenn(membership, width = 6, height = 4)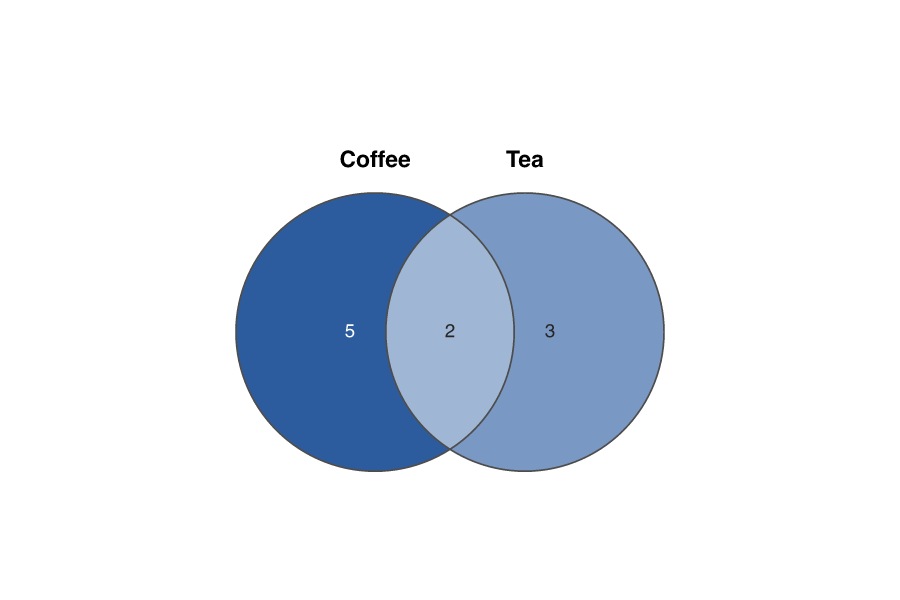
Because the regions are geometry and not compositing, this is one of the cases where the PDF is the better output rather than the lossy one: render the same spec with render_plot(p, "sets.pdf") and every region stays a single exact path at any zoom.
vvenn() handles 2 or 3 sets. Beyond three, circles cannot represent all disjoint combinations anyway, which is a fact about Venn diagrams rather than about this implementation.