mt <- data.frame(car = rownames(mtcars), mpg = mtcars$mpg)
mt <- mt[order(mt$mpg), ][1:12, ]
mt$i <- seq_len(nrow(mt))

p <- vplot(mt) |>
  mark_segment(x = i, y = 0, xend = i, yend = mpg) |>
  mark_point(x = i, y = mpg, size = 1.8, color = "#2b6cb0") |>
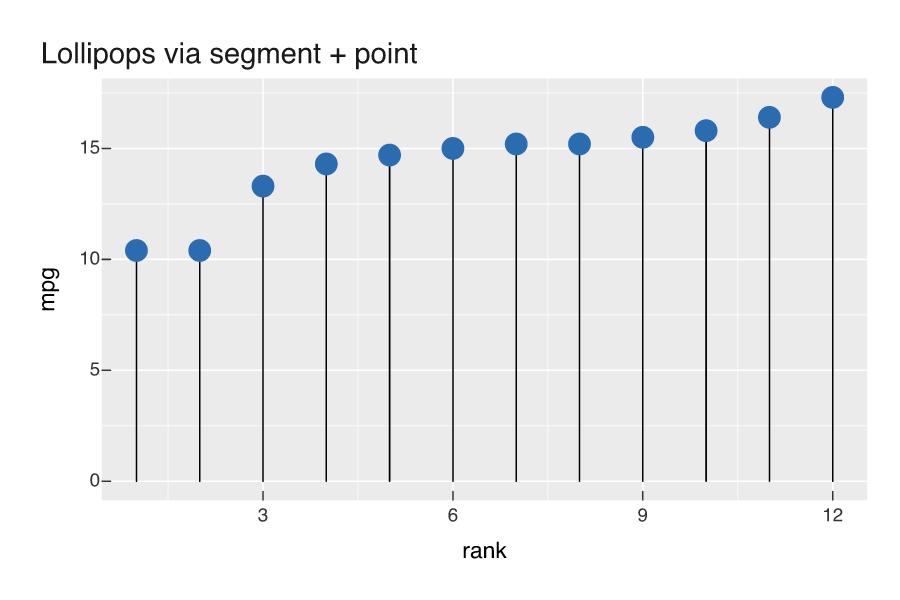
labs(title = "Lollipops via segment + point", x = "rank", y = "mpg")Lollipop chart
Basics
A lollipop built from primitives: a segment mark for the stems and a point mark for the heads.
There is no dedicated lollipop mark, and there does not need to be: compose one from a mark_segment() and a mark_point().