peng <- na.omit(datasets::penguins)

# One kernel density per species, as a tidy data frame.
dens <- function(s) {
  d <- density(peng$flipper_len[peng$species == s], adjust = 1.1)
  data.frame(x = d$x, y = d$y)
}
adelie <- dens("Adelie"); chinstrap <- dens("Chinstrap"); gentoo <- dens("Gentoo")

peak <- function(d) d[which.max(d$y), ]Paint model, meet the grammar
Backend
Statistical
The same gradient fills and blend modes from the paint-model page, dropped straight into a vellumplot chart through mark aesthetics.
The paint model page drew gradients and blend modes with raw vellum grobs. None of that is locked away in the backend: a mark’s fill accepts a linear_gradient() just like a colour string, and every mark takes a blend argument. So a plain grammar-of-graphics chart can paint with the full model.
Here three species’ flipper-length densities are drawn as gradient-filled areas that fade to transparent, then composited with blend = "screen". Screen lightens, so wherever two distributions overlap the colour brightens toward white instead of one area hiding the other.
Two things to know when you reach for a gradient in the grammar. Write the linear_gradient() inline: vellumplot reads a literal gradient constructor as a constant fill, but a value handed back from a helper as a mapped aesthetic. And the fade to transparent is just an "…00" alpha suffix on the end colour.
p <- vplot(adelie) |>
  mark_area(data = adelie,    x = x, y = y, color = "#08F7FE", blend = "screen",
            fill = linear_gradient(c("#08F7FE", "#08F7FE00"), x1 = 0, y1 = 0, x2 = 0, y2 = 1)) |>
  mark_area(data = chinstrap, x = x, y = y, color = "#FE53BB", blend = "screen",
            fill = linear_gradient(c("#FE53BB", "#FE53BB00"), x1 = 0, y1 = 0, x2 = 0, y2 = 1)) |>
  mark_area(data = gentoo,    x = x, y = y, color = "#F5D300", blend = "screen",
            fill = linear_gradient(c("#F5D300", "#F5D30000"), x1 = 0, y1 = 0, x2 = 0, y2 = 1)) |>
  annotate("text", x = peak(adelie)$x,    y = peak(adelie)$y + 0.004,
           label = "Adelie",    color = "#08F7FE", fontface = "bold", size = 4.5) |>
  annotate("text", x = peak(chinstrap)$x, y = peak(chinstrap)$y + 0.004,
           label = "Chinstrap", color = "#FE53BB", fontface = "bold", size = 4.5) |>
  annotate("text", x = peak(gentoo)$x,    y = peak(gentoo)$y + 0.004,
           label = "Gentoo",    color = "#F5D300", fontface = "bold", size = 4.5) |>
  labs(title = "Where three penguin species overlap",
       subtitle = "Gradient area fills, screen-blended so overlaps brighten",
       x = "Flipper length (mm)", y = "Density") |>
  theme_cyberpunk()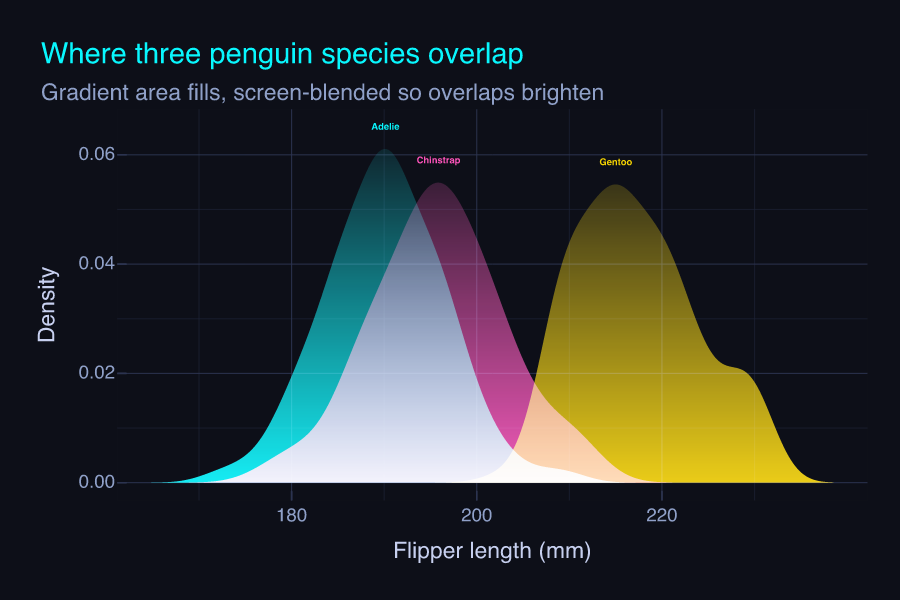
The colour-matched peak labels stand in for a legend, since the fills are constants rather than a mapped scale. Without the blend this would be an ordinary density plot: a normal fill with per-area transparency only tints where two areas overlap, whereas screen composites each area as an isolated layer and adds their light, so the Adelie-Chinstrap crossover reads as a bright seam. Swap "screen" for "multiply", "overlay", or any other mix-blend-mode to change how the layers mix. The paint model page lays the whole set out on a grid.