p <- vplot(faithful) |>
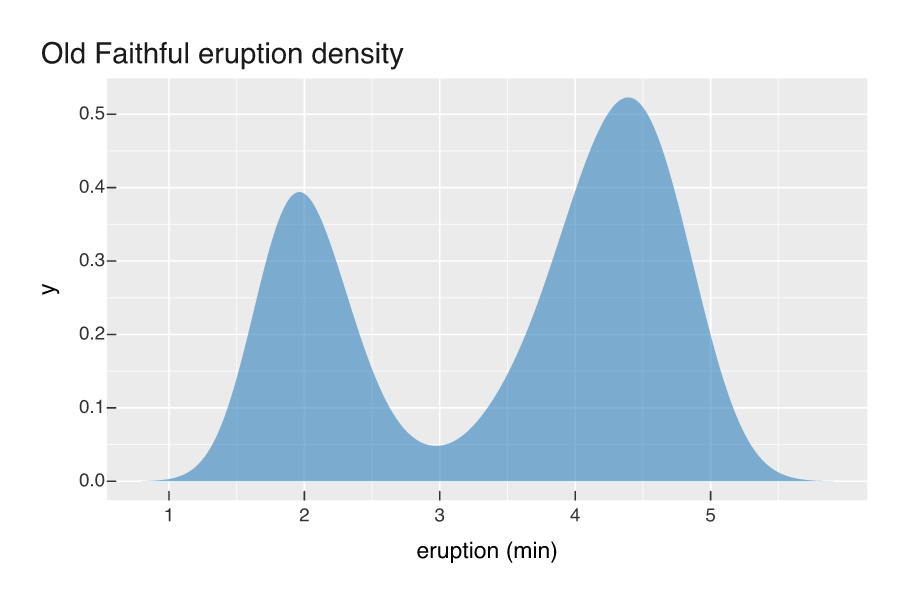
  mark_density(x = eruptions, fill = "#3182bd", alpha = 0.6, adjust = 0.8) |>
labs(title = "Old Faithful eruption density", x = "eruption (min)")Density curve
Statistical
A kernel density estimate as a filled area, with an adjustable bandwidth.
mark_density() estimates a kernel density and fills the area beneath it. The adjust argument scales the bandwidth.