set.seed(1)
n <- 20000
df <- data.frame(x = rnorm(n), y = rnorm(n) + rnorm(n, 0, 0.4))

p <- vplot(df) |>
  mark_hex(x = x, y = y, bins = 30) |>
  scale_fill_continuous(palette = "Batlow") |>
labs(title = "Twenty thousand points, hexagonal bins")Hexagonal binning
Heatmaps
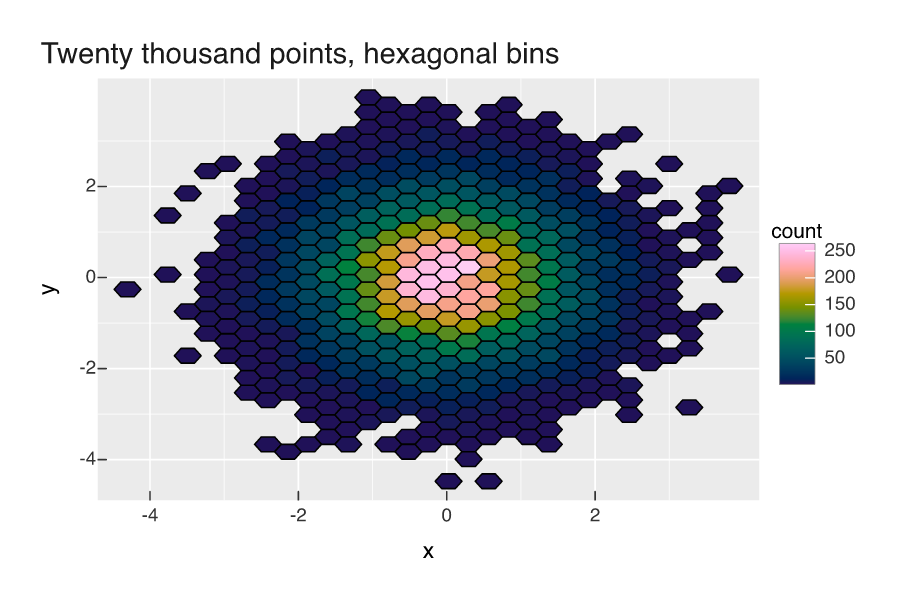
Twenty thousand points binned into hexagons, shaded by count with a perceptual palette.
When a scatter would be an unreadable blob, bin it. mark_hex() aggregates points into hexagonal cells; scale_fill_continuous() takes a named perceptual palette (here Batlow).