set.seed(1)
metrics <- data.frame(
  metric = c("Revenue", "Users", "Latency", "Errors"),
  latest = format(c(4213, 18402, 128, 37), big.mark = ",", trim = TRUE),
  change = c("+4.2%", "+1.1%", "-8ms", "-12%")
)
metrics$trend  <- lapply(1:4, function(i) cumsum(rnorm(24)))
metrics$volume <- lapply(1:4, function(i) rpois(20, 6))

p <- vtable(metrics, spark = list(trend = "line", volume = "bar"), row_height = 8)Sparklines in a table
Statistical
vtable() renders a data frame with a list-column of vectors as per-row sparklines; gt_vsparkline() does the same inside a gt table.
A metrics table usually shows where each number ended: revenue this month, errors this week. It rarely shows how the number got there. A sparkline column adds that path without adding a chart. vellumplot builds it two ways, depending on whether you want a plain rendered table or a live gt one.
vtable() takes a data frame where one or more columns are list-columns of numeric vectors, and draws the whole thing as a single vector scene: ordinary columns become text, the list-columns become per-row sparklines. spark maps each such column to a shape.
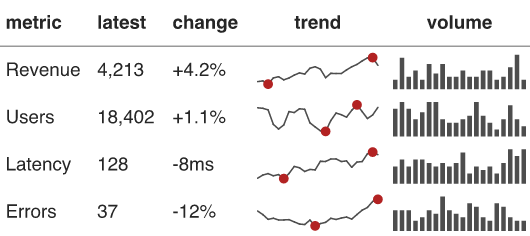
Every row’s trend is a line sparkline and every row’s volume a bar one, drawn from the vectors in those columns. The result is one PNG (or SVG, or PDF): no per-cell image files, no HTML.
The same thing in a gt table
If you already build tables with gt, gt_vsparkline() adds a sparkline column while keeping gt’s own formatting and theming. It embeds each chart as inline SVG through plot_svg(), so this table is live HTML on the page, not a screenshot.
library(gt)
set.seed(1)
svc <- data.frame(metric = c("Revenue", "Users", "Latency", "Errors"))
svc$trend  <- lapply(1:4, function(i) cumsum(rnorm(24)))
svc$volume <- lapply(1:4, function(i) rpois(20, 6))

gt(svc) |>
  tab_header(title = "Service metrics") |>
  gt_vsparkline(trend, type = "line") |>
gt_vsparkline(volume, type = "bar", color = "#4682b4")| Service metrics | ||
| metric | trend | volume |
|---|---|---|
| Revenue | ||
| Users | ||
| Latency | ||
| Errors | ||
plot_svg() is the piece doing the work in both the inline-text examples and this table: it turns any vellumplot object into a self-contained SVG string. The same call embeds a chart in a reactable or DT cell, or anywhere else that accepts an HTML fragment.