Every building in Berlin
No streets are drawn here, and no labels. Every pale shape is one building footprint; the black between them is everything else, mostly roads. At 536,700 buildings the city draws itself: the radial arms reaching out from the centre, Tempelhofer Feld as the clean void in the south (the old airport), the Grunewald forest biting into the west, and the lakes and the Spree cutting dark channels through the fabric.
This example is not run when the site is built. It reads a ~94 MB .osm.pbf from disk and needs the sf package. The image below is the real output, committed with the site; the script at the end is the exact source. The extract is Geofabrik’s Berlin download.
The map
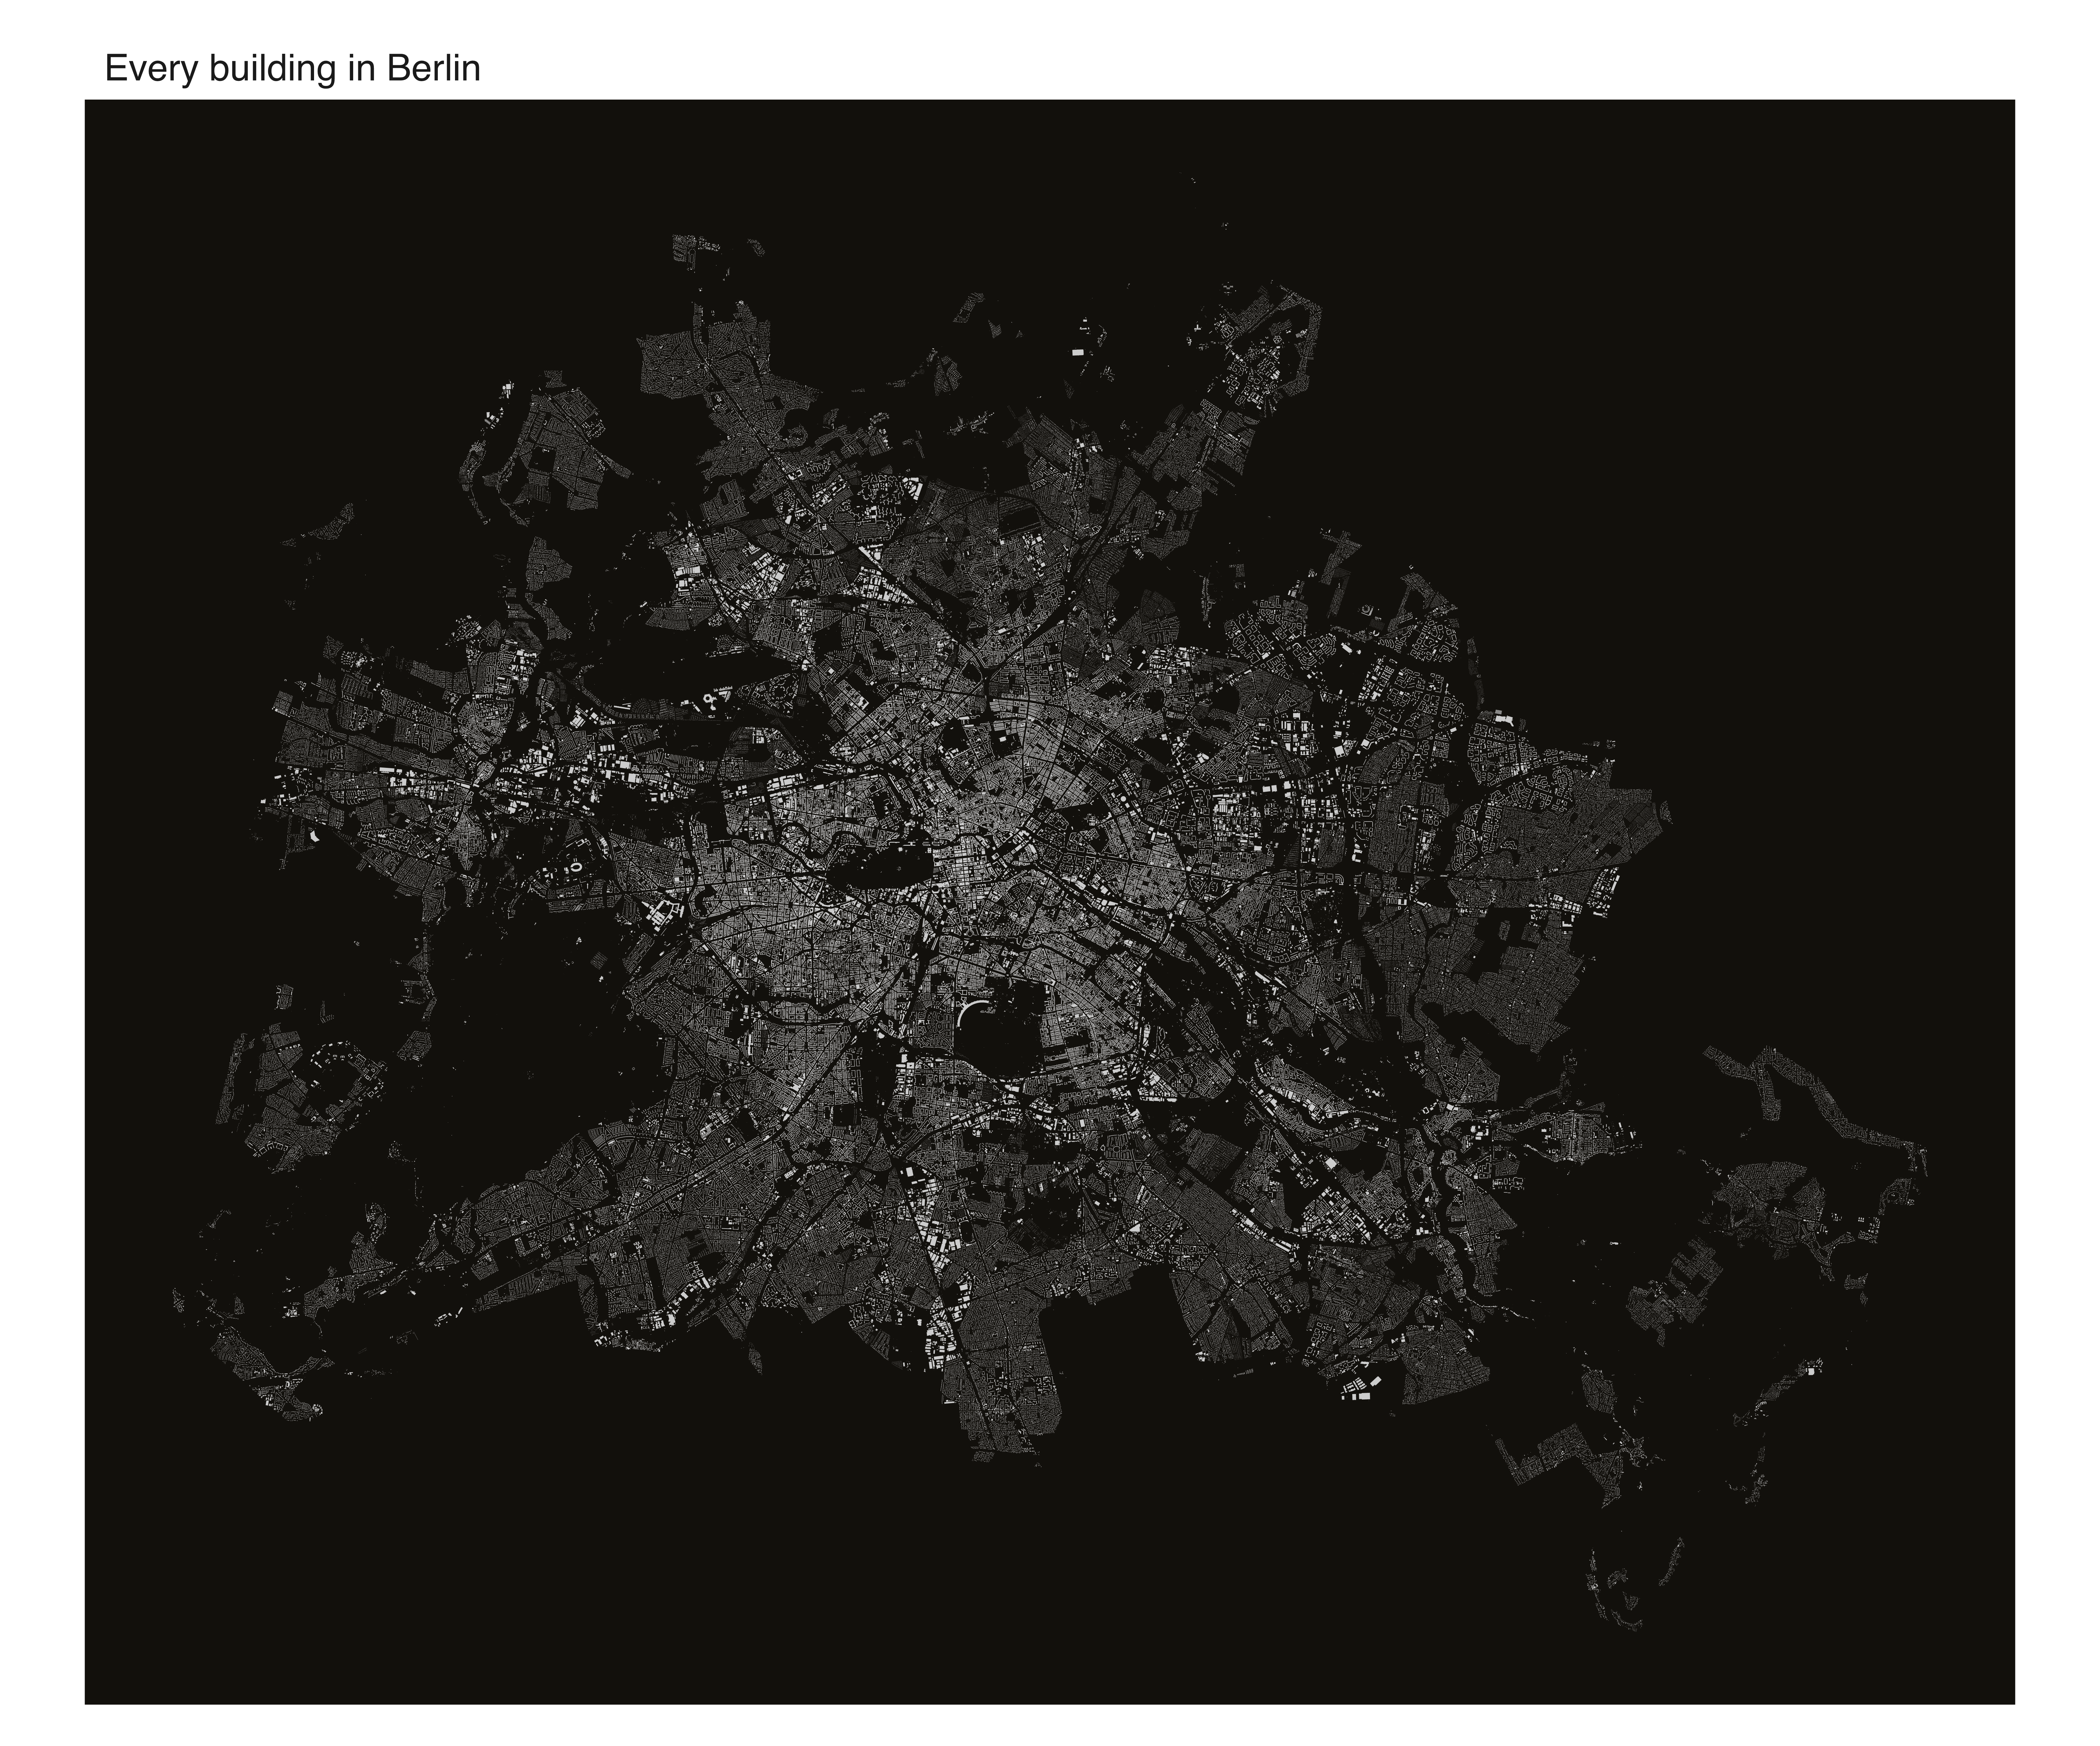
Rendered at 6600 px, so it rewards zooming: the Altbau blocks show their inner courtyards, the villa districts on the edges thin to loose scatter, and the post-war estates read as their own coarse-grained texture against the fine grid of the nineteenth-century core.
The script
# Every building in Berlin, as a figure-ground map.
#
# Reads all building polygons from the .osm.pbf through GDAL's OSM driver -- the
# `multipolygons` layer assembles closed ways and multipolygon relations into
# geometry -- and draws the footprints with mark_sf().
#
# REQUIREMENTS (none are vellumplot dependencies -- this is a heavy showcase):
#   * package `sf`
#   * a Berlin .osm.pbf from
#     https://download.geofabrik.de/europe/germany/berlin.html

library(sf)
library(vellumplot)

pbf <- path.expand("~/Downloads/berlin-latest.osm.pbf")

# GDAL assembles the multipolygons layer; keep every building's geometry.
b <- st_read(
  pbf,
  query = "SELECT osm_id FROM multipolygons WHERE building IS NOT NULL",
  quiet = TRUE
)["geometry"]
message(format(nrow(b), big.mark = ","), " buildings")

# Frame to the data's own aspect (latitude-corrected) so nothing is stretched.
bb <- st_bbox(b)
asp <- (bb["ymax"] - bb["ymin"]) /
  ((bb["xmax"] - bb["xmin"]) * cos(mean(c(bb["ymin"], bb["ymax"])) * pi / 180))

# Single warm fill on a dark ground; the unfilled space is the street network.
# High dpi so the small footprints stay crisp when zoomed.
vplot(b, width = 11, height = 11 * asp, dpi = 600) |>
  mark_sf(fill = "#e8cf9f", color = NA) |>
  coord_sf() |>
  theme_void() |>
  set_theme(panel_bg = "#12100c") |>
  labs(title = "Every building in Berlin") |>
  render_plot("berlin-buildings.png")