peng <- na.omit(datasets::penguins)

box <- vplot(peng) |>
  mark_boxplot(x = species, y = flipper_len, fill = species) |>
  labs(title = "Boxplot", y = "flipper (mm)")

vio <- vplot(peng) |>
  mark_violin(x = species, y = flipper_len, fill = species) |>
  labs(title = "Violin", y = NULL)

p <- hconcat(box, vio)Boxplots and violins
Statistical
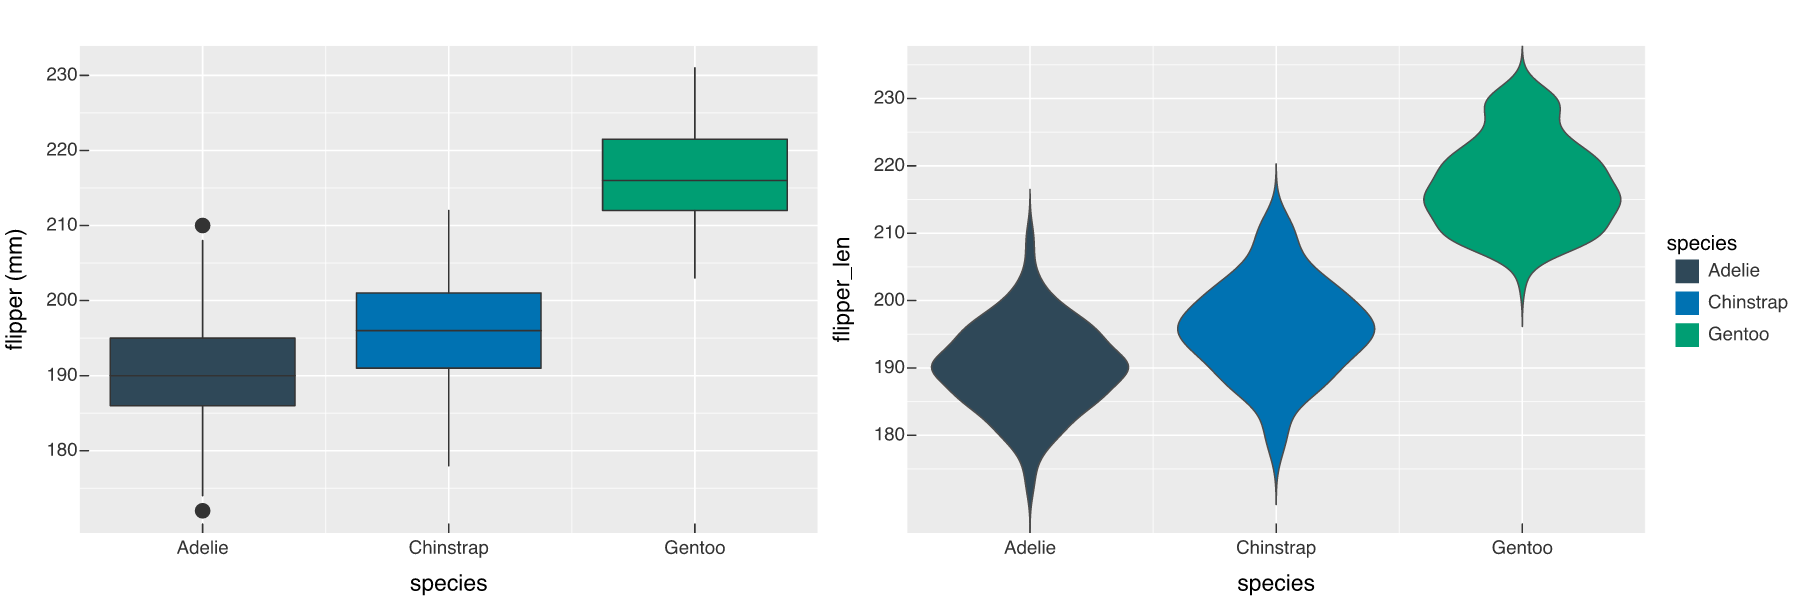
Two views of the same grouped distribution: a boxplot and a violin, side by side.
mark_boxplot() and mark_violin() both summarise a continuous variable across a discrete group. Here they are composed into a single figure with hconcat().