budget <- data.frame(
  id = c(
    "Budget",
    "Engineering", "Sales", "Marketing",
    "Frontend", "Backend", "Infra",
    "Field", "Inside",
    "Digital", "Events"
  ),
  parent = c(
    NA,
    "Budget", "Budget", "Budget",
    "Engineering", "Engineering", "Engineering",
    "Sales", "Sales",
    "Marketing", "Marketing"
  ),
  value = c(NA, NA, NA, NA, 20, 28, 12, 18, 10, 14, 6)
)Hierarchy diagrams
Hierarchies
One tree drawn four ways from the same parent list: sunburst, treemap, circle-pack, and icicle, switched with a single argument.
vhierarchy() reads a parent list: one row per node carrying an id, its parent (NA at the root), and a value for the leaves. An internal node’s value is the sum of its children, so you only supply the leaves. The type argument picks the geometry, and nothing else changes, so the same tree can be redrawn a different way by editing one word.
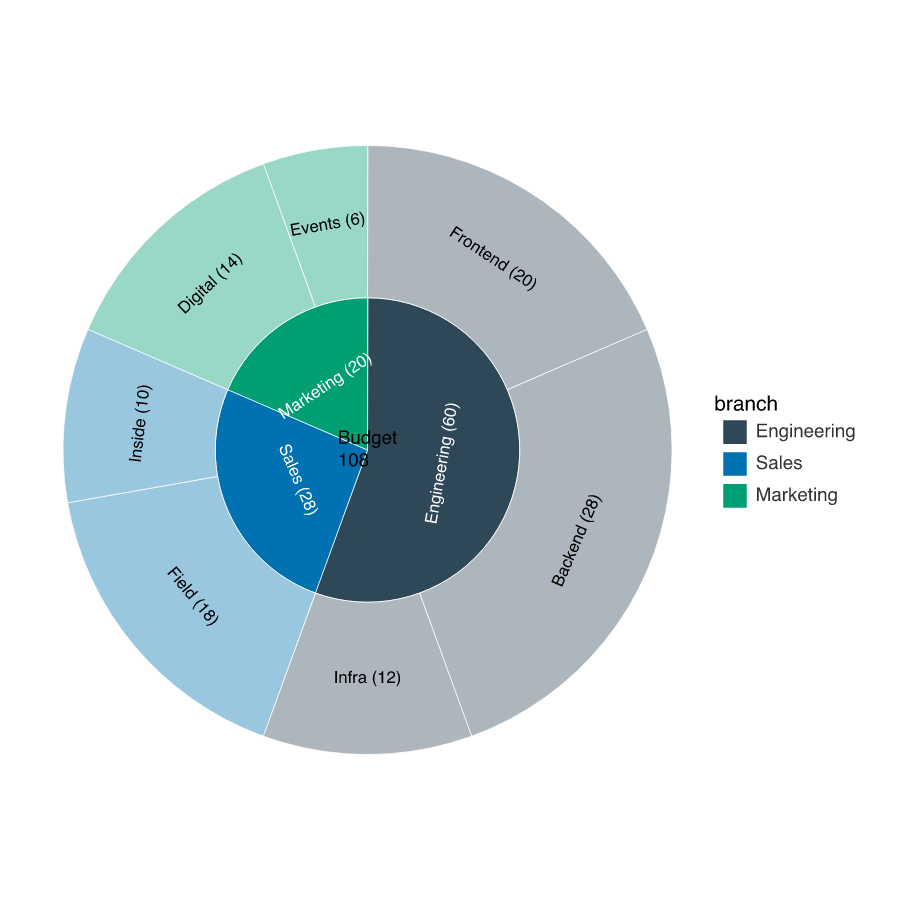
The default type = "sunburst" maps depth to concentric rings and each node’s angular span to its share of its parent. The root is the centre; root_label prints its total there.
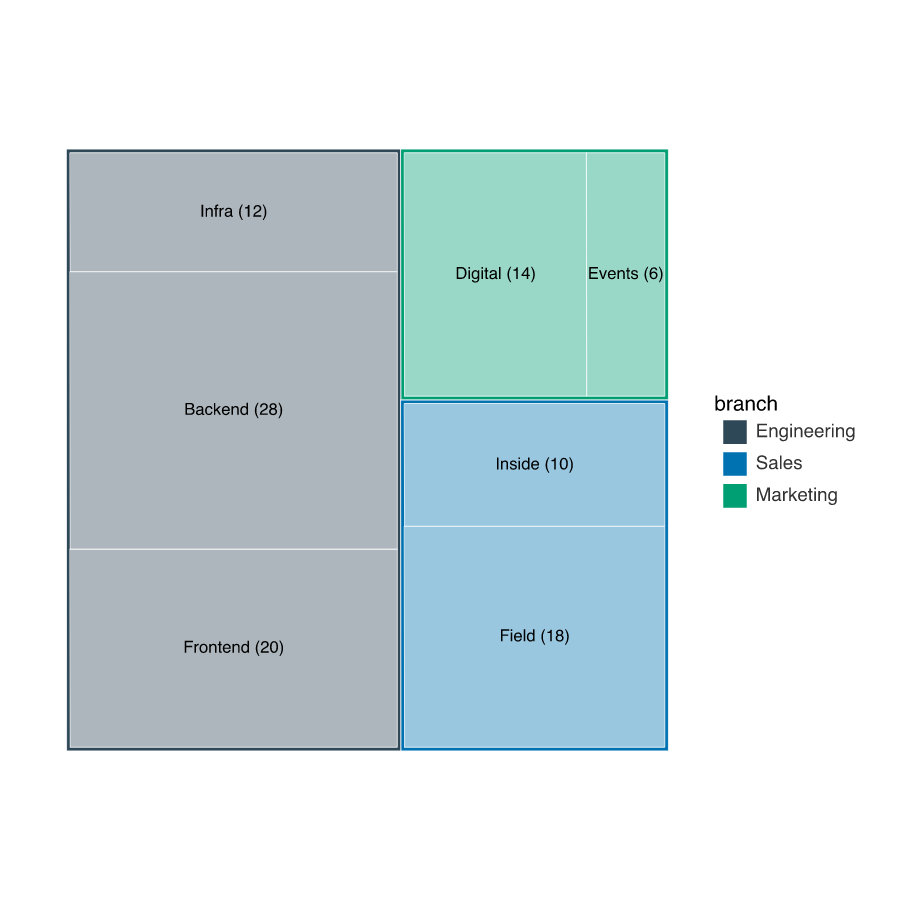
type = "treemap" packs the tree into nested rectangles sized by value, using a squarified layout that keeps each rectangle close to square. Every branch keeps its own hue, lightened one step per level, and shows as a thin frame around its children.
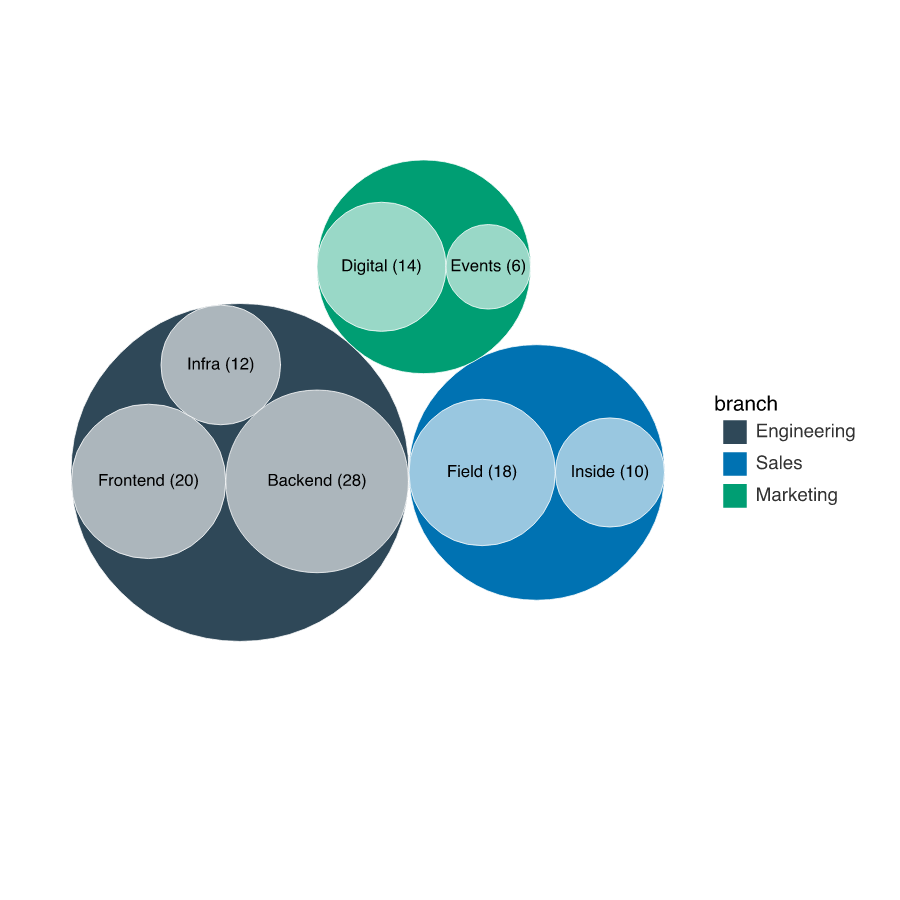
type = "circlepack" nests circles instead of rectangles. A leaf’s radius grows with the square root of its value, and each branch is the smallest circle that encloses its children.
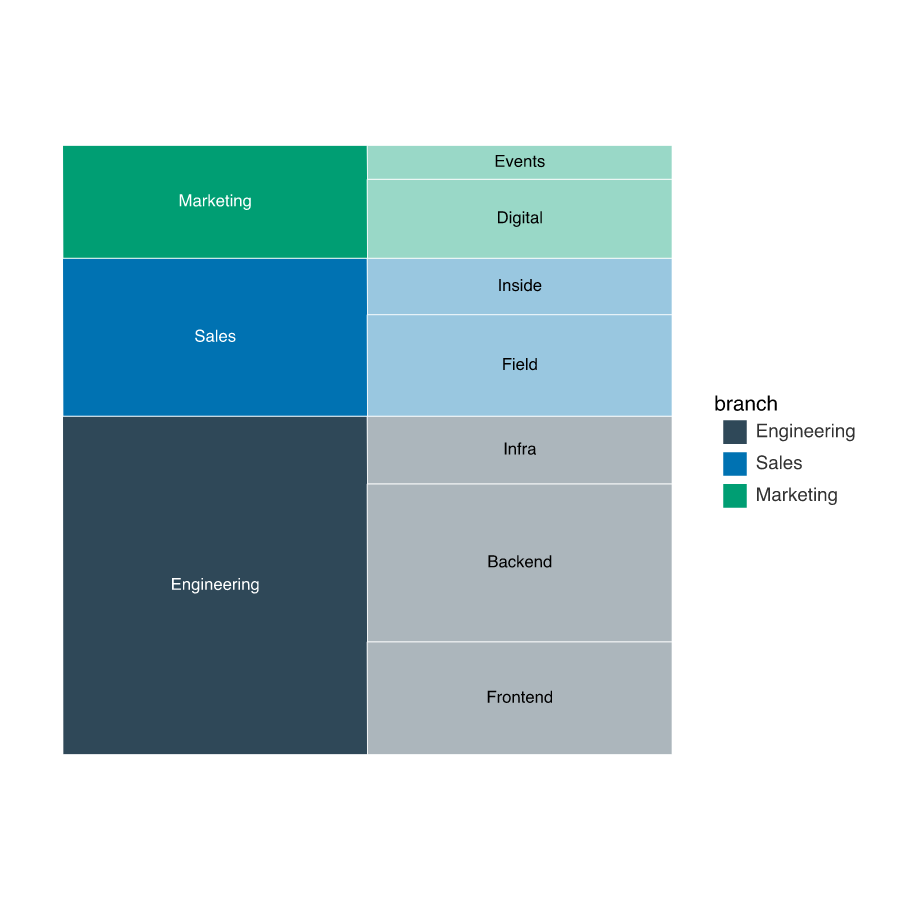
type = "icicle" is the rectangular twin of the sunburst: depth becomes a stack of adjacent bands rather than rings. Set flow to run the levels down, up, left, or right.