p <- vplot(mtcars, width = 8, height = 3.4) |>
  mark_point(x = wt, y = mpg) |>
  facet_wrap(~cyl) |>
labs(title = "Weight vs. mpg, faceted by cylinder count")Faceting
Composition
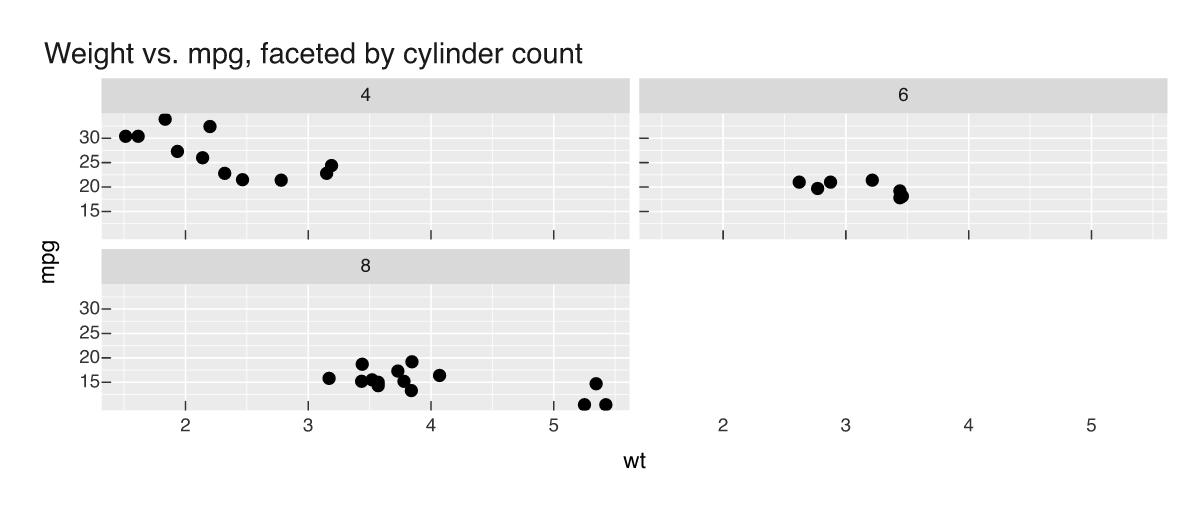
Small multiples: one panel per level of a grouping variable with facet_wrap().
facet_wrap() splits the data into a panel per group, sharing scales so the panels are directly comparable.