by_cyl <- lapply(sort(unique(mtcars$cyl)), function(k) {
  d <- mtcars[mtcars$cyl == k, ]
  vplot(d, width = 7, height = 4.2) |>
    mark_point(x = wt, y = mpg, size = 2.4, color = "#6b4f2c") |>
    mark_smooth(x = wt, y = mpg, method = "lm", se = TRUE) |>
    labs(title = paste(k, "cylinders"), x = "weight (1000 lbs)", y = "mpg")
})

pdf_pages(by_cyl, "figs/documents-report.pdf")Reports, decks, and batch export
Composition
pdf_pages() writes many plots into one PDF, or splits a faceted plot into one page per facet, and render_all() renders a list of plots to separate files across CPU cores.
A figure is rarely the deliverable. The deliverable is a report with eleven of them, or a directory of one PNG per region for somebody else’s slide deck. Both of those are loops around render_plot() that everyone rewrites, so they are in the package.
pdf_pages() writes several plots into one PDF, one plot per page. Pages may differ in size, since each plot keeps its own width/height, and the accessibility tags go into every page, so a multi-page report is as navigable as a single tagged figure.
Open the three-page PDF. Nothing about the pages is special: each is the same solved scene render_plot() would have written on its own.
One page per facet
The other input pdf_pages() accepts is a single faceted plot, which it splits into one page per facet cell. The facet is dropped, the data filtered per page, and each page trains its own scales. That is the difference between a small-multiples figure and a document where every cell gets the whole page and its own axes.
faceted <- vplot(mtcars, width = 7, height = 4.4) |>
  mark_point(x = wt, y = mpg, size = 2.2, color = "#6b4f2c") |>
  facet_wrap(~cyl) |>
  labs(title = "One figure...", x = "weight (1000 lbs)", y = "mpg")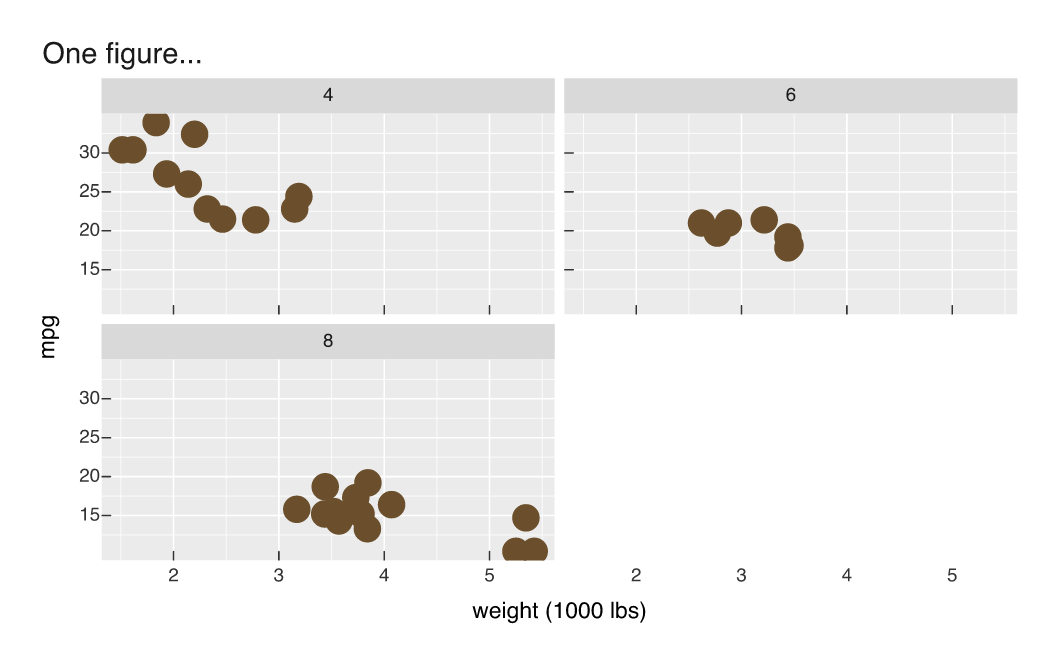
pdf_pages(faceted, "figs/documents-facets.pdf")Rendering a batch in parallel
render_all() takes a list of plots and a list of paths, and renders them across CPU cores. Whole plots are independent, so this is embarrassingly parallel, and the output is byte-identical to rendering them one at a time. That last property is what makes it safe for anything snapshot-tested.
names(by_cyl) <- paste0("documents-cyl", sort(unique(mtcars$cyl)))
render_all(by_cyl, "figs")
When the list is named, paths may be a single existing directory and each plot is written to <name>.png inside it. Otherwise pass one path per plot, and each format follows its own extension. Parallelism uses process forks, so it speeds things up on macOS and Linux and falls back to sequential on Windows; workers = 1 forces that everywhere. It is worth reaching for when the plots are substantial. For three small scatters, the fork overhead is most of the runtime.
Both build on the engine’s vellum::pdf_pages() and vellum::render_all(). For arranging several plots inside one figure rather than across pages, see Composing plots.