peng <- na.omit(datasets::penguins)

p_scatter <- vplot(peng) |>
  mark_point(x = bill_len, y = flipper_len, color = species)
p_hist <- vplot(peng) |>
  mark_histogram(x = body_mass, bins = 20, fill = species)
p_box <- vplot(peng) |>
  mark_boxplot(x = species, y = bill_dep, fill = species)

p <- concat(
  p_scatter, p_hist, p_box,
  design = "
    AA
    BC
  "
)Composing plots
Composition
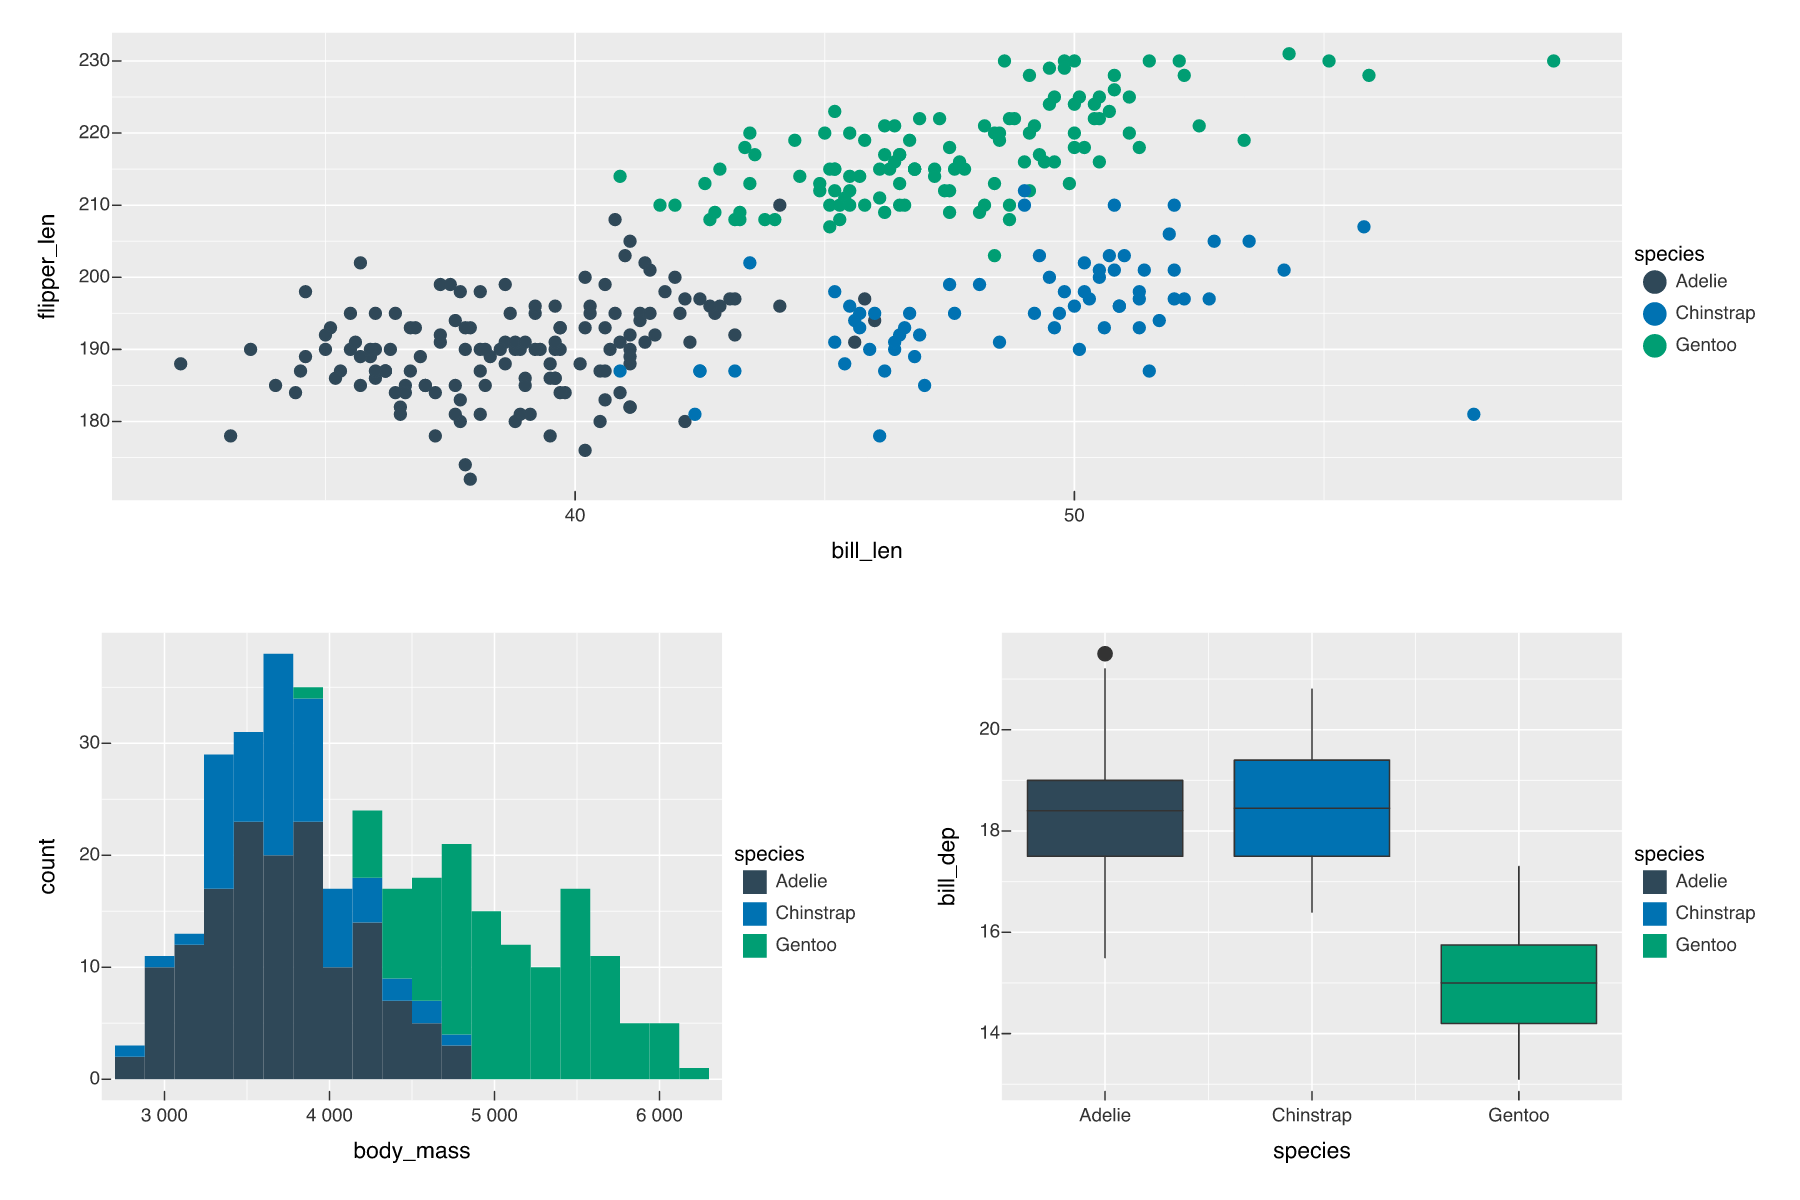
Arrange several independent plots into one figure with a patchwork-style design string.
vellumplot composes finished plots the way patchwork does, but with functions instead of operators. A design string lays panels out on a grid; here one wide scatter sits on top (A) and two panels below (B, C).