switch <- matrix(
  c(
    40, 12, 8, 5,
    10, 55, 6, 9,
    7, 8, 38, 11,
    6, 10, 9, 44
  ),
  nrow = 4, byrow = TRUE,
  dimnames = list(
    c("Aircel", "Boost", "Cellcom", "Ditto"),
    c("Aircel", "Boost", "Cellcom", "Ditto")
  )
)
p <- vchord(switch)Chord diagram
Flows
Directed flows between a handful of nodes, wrapped onto a circle with an out/in split and self-loops.
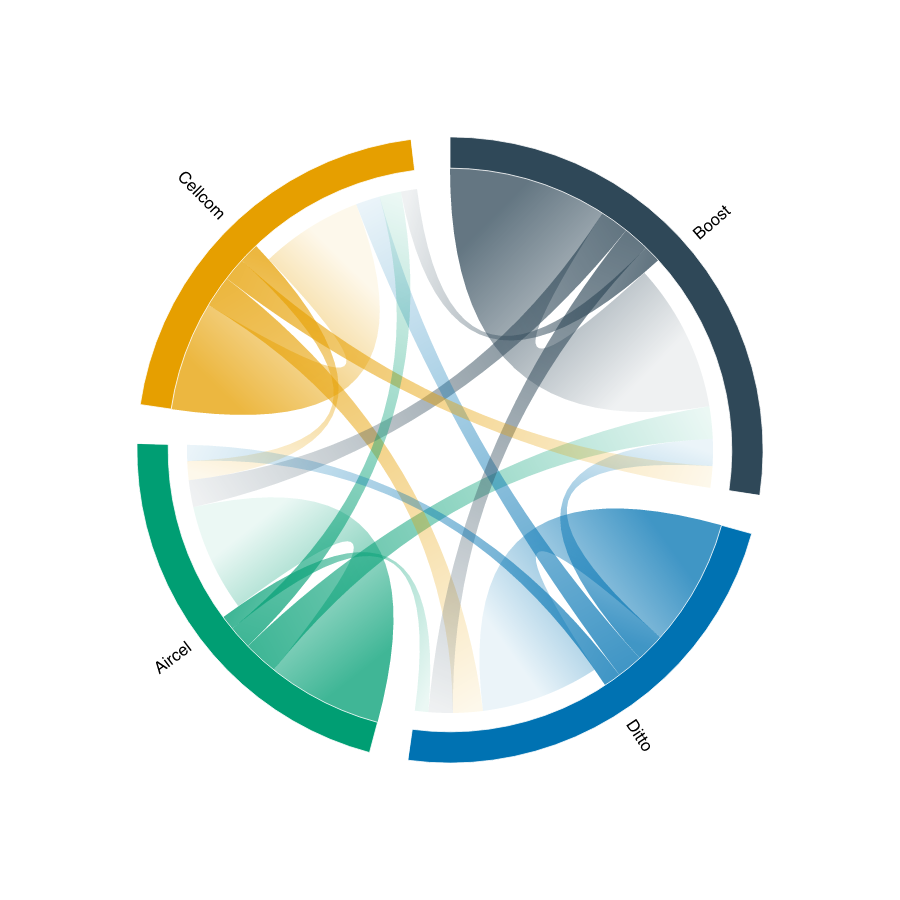
vchord() wraps a weighted flow onto a circle: one arc per node, sized by the node’s total incident weight, and one ribbon per flow joining the source arc to the target arc through the centre. It takes a from/to/value flow list or a square flow matrix (row = from, column = to).
Here each cell is the number of customers who moved from one carrier to another over a year; the diagonal is those who stayed.
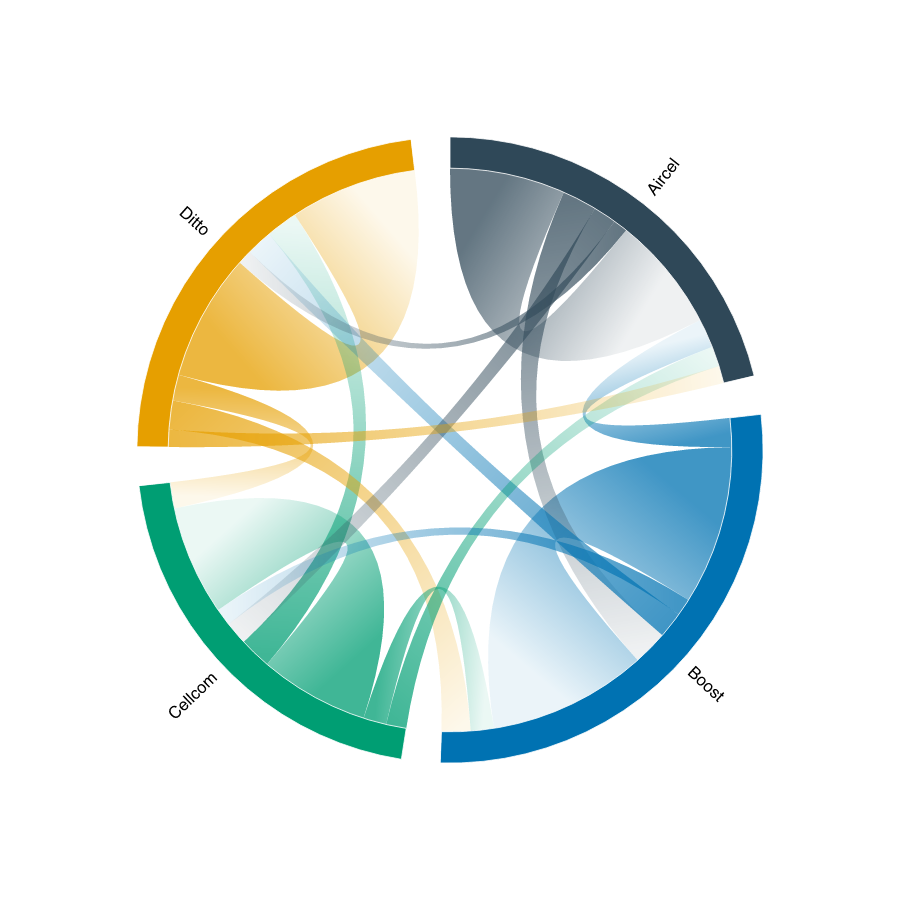
Flows are directed, so each node’s arc is split into an outgoing block and an incoming block. Aircel -> Boost and Boost -> Aircel become separate ribbons, and each carrier’s retained customers (Aircel -> Aircel) loop as a self-ribbon within its own sector. By default direction = "gradient" fades each ribbon from its source to its target so the flow direction reads at a glance; "gap" instead stops the ribbon just short of the target, and "both" does both. sort = "value" orders sectors by weight.
p <- vchord(switch, sort = "value", direction = "both")