nc <- sf::st_read(system.file("shape/nc.shp", package = "sf"), quiet = TRUE)

p <- vplot(nc, width = 8, height = 3.6) |>
  mark_sf(fill = BIR74) |>
  coord_sf() |>
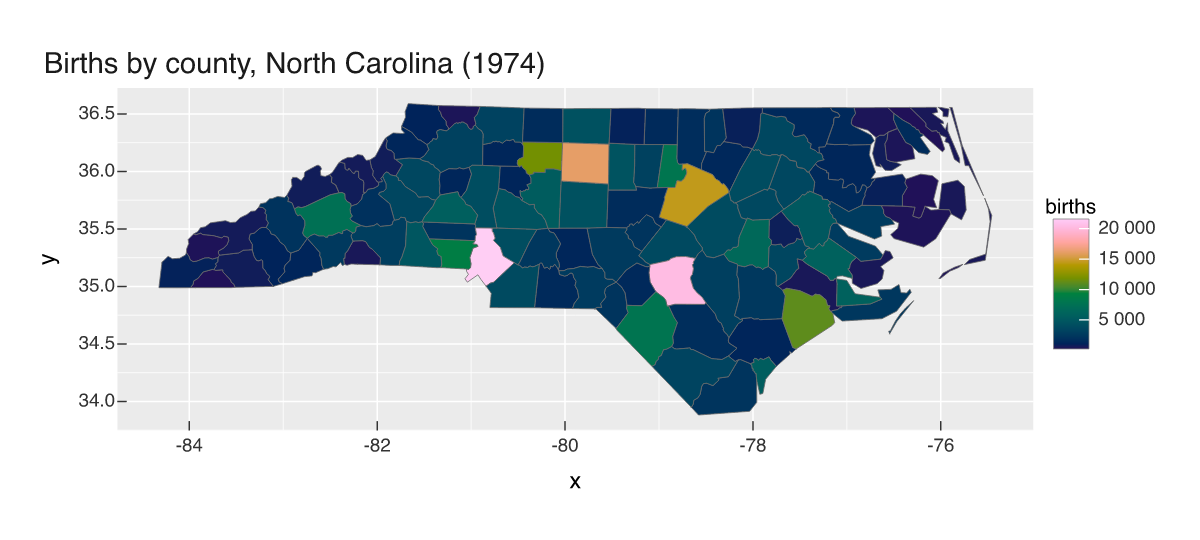
labs(title = "Births by county, North Carolina (1974)", fill = "births")Choropleth map
Spatial
An sf object drawn directly with mark_sf() and a proper map projection via coord_sf().
vellumplot reads simple-features geometry directly. mark_sf() draws the polygons and coord_sf() handles the projection and aspect ratio.
For a version you can hover, select, and zoom, see the interactive choropleth.
Dissolving the borders between equal values
Bin the values and a per-feature choropleth starts to lie about its own geometry. Neighbouring counties in the same class are drawn as separate polygons, so a border is stroked twice down the middle of what should read as one region: a visible seam, and in PDF an exact one.
mark_sf(merge = TRUE) dissolves adjacent features that share a fill into a single region. The union is real boolean geometry (vellum::vl_path_op()), holes and multipart features preserved, so each region comes out as one crisp path rather than a stack of alpha-composited neighbours.
nc$class <- cut(nc$BIR74, breaks = c(0, 1000, 2000, 4000, Inf),
                labels = c("under 1k", "1k–2k", "2k–4k", "over 4k"))

p_merged <- vplot(nc, width = 8, height = 3.6) |>
  mark_sf(fill = class, merge = TRUE) |>
  coord_sf() |>
  labs(title = "Birth classes, merged into regions", fill = "births")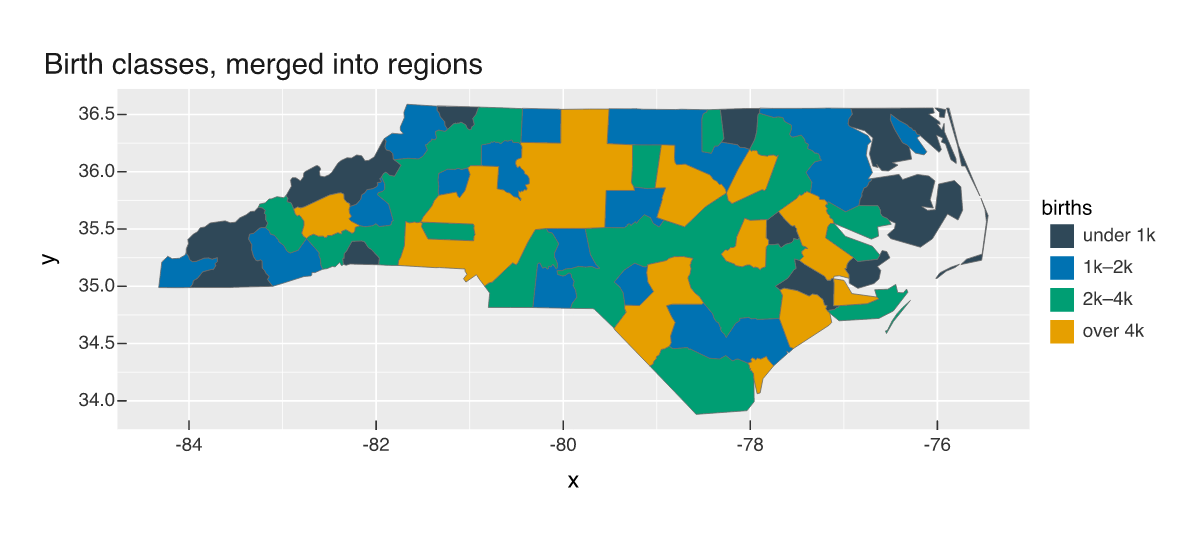
Compare it with the same classes drawn feature by feature. Same colours, but every county boundary is still there, including the ones between counties of the same class:
p_unmerged <- vplot(nc, width = 8, height = 3.6) |>
  mark_sf(fill = class, color = "white", linewidth = 0.2) |>
  coord_sf() |>
  labs(title = "The same classes, one path per county", fill = "births")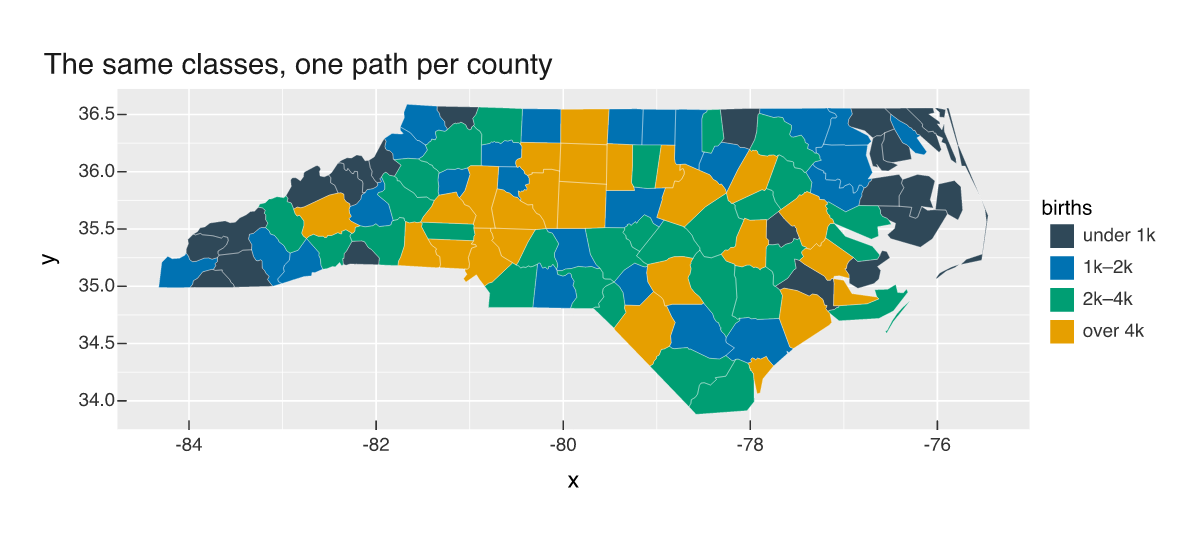
merge is ignored on an interactive layer, and necessarily so: merging throws away the per-feature keys a widget needs to know which county you hovered.
For the cartographic furniture (a scale bar, a north arrow, a graticule) see Scale bar, north arrow, graticule.