peng <- na.omit(datasets::penguins)

p <- vplot(peng) |>
  mark_bar(x = species, fill = species) |>
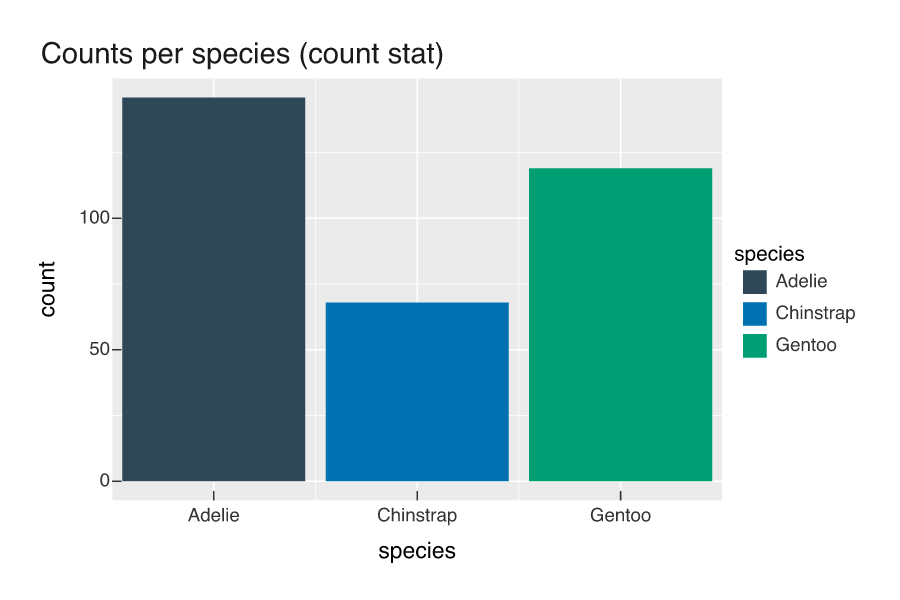
labs(title = "Counts per species (count stat)", y = "count")Bar chart with a count stat
Basics
A bar mark that counts rows per category: the count stat, used when no y is supplied.
Give mark_bar() a discrete x and no y, and it counts rows per category.