m <- datasets::USPersonalExpenditure
spend <- data.frame(
  category = factor(rep(rownames(m), ncol(m)), levels = rownames(m)),
  year = factor(rep(colnames(m), each = nrow(m)), levels = colnames(m)),
  dollars = as.vector(m)
)

p <- vplot(spend) |>
  mark_bar(x = year, y = dollars, pattern = category, position = "stack") |>
  scale_pattern() |>
labs(title = "US personal spending, 1940 to 1960", x = NULL, y = "billion $")Hatched fills for greyscale
Accessibility
Basics
Pattern fills tell stacked categories apart by texture, so the chart survives a black-and-white print and colour-blind readers.
Colour is the usual way to separate categories in a bar chart, and it is the first thing to fail: photocopied to greyscale, or read by someone with colour-vision deficiency, the categories collapse into indistinguishable greys. A texture survives both. vellumplot fills any shape with a repeating pattern through the pattern_*() family, so a filled mark can carry a distinction that does not depend on hue.
Map the pattern aesthetic to a variable and add scale_pattern(); each level picks up a different texture and the legend shows it. The data is datasets::USPersonalExpenditure, five spending categories tracked across five years.
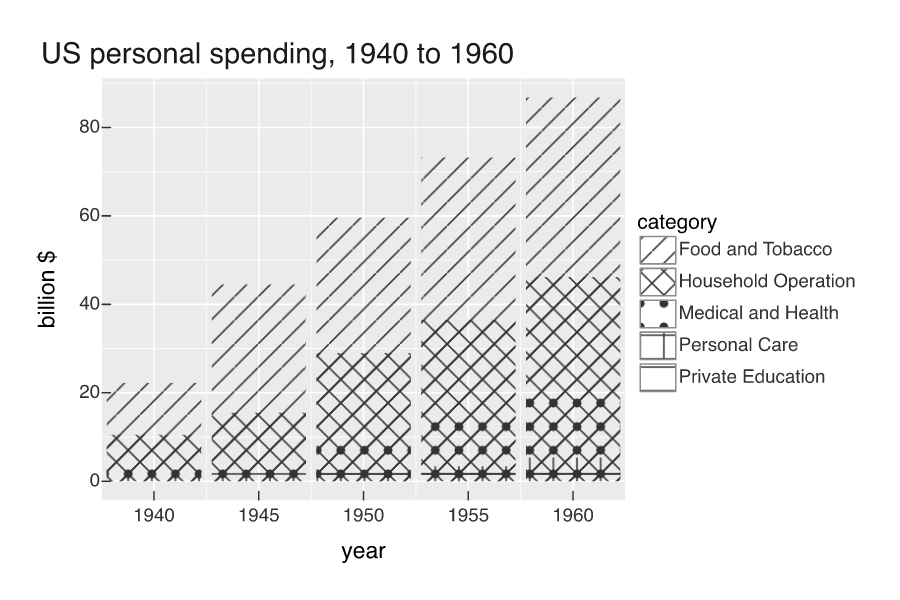
Nothing in that image relies on colour. Print it, photocopy it, or hand it to a reader who cannot separate red from green, and the five bands stay apart.
The builders
Five constructors cover the common textures. Each takes a line color, a background bg, and a spacing in millimetres; pattern_stripe() also takes an angle (one of 0, 45, 90, 135) and pattern_dot() and pattern_checker() take a size. Pass a list of them to scale_pattern(values = ) to control which texture each level gets.
builders <- data.frame(
  builder = factor(
    c("stripe", "crosshatch", "grid", "dot", "checker"),
    levels = c("stripe", "crosshatch", "grid", "dot", "checker")
  ),
  h = 1
)

p <- vplot(builders) |>
  mark_bar(x = builder, y = h, pattern = builder) |>
  scale_pattern(values = list(
    stripe = pattern_stripe(color = "grey20"),
    crosshatch = pattern_crosshatch(color = "grey20"),
    grid = pattern_grid(color = "grey20"),
    dot = pattern_dot(color = "grey20"),
    checker = pattern_checker(color = "grey20")
  )) |>
  labs(title = "The five pattern builders", x = NULL, y = NULL)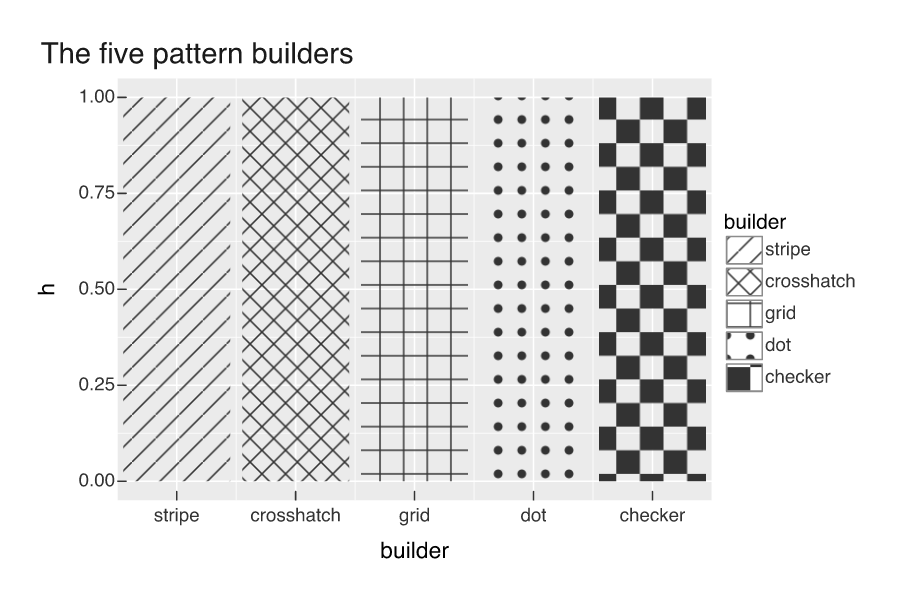
To hatch a single shape without a legend, write the builder straight into fill (mark_bar(fill = pattern_crosshatch())). The pattern aesthetic works the same way on areas, tiles, boxplots, violins, ridgelines, and sf polygons, so a greyscale-safe legend is one line away on any filled mark.
The vector one
Those five are tiles: a small image repeated across the shape. pattern_hatch() is their vector counterpart, evenly spaced parallel lines produced as real geometry (vellum::vl_hatch()) instead of a rasterised tile. Two things follow. It stays crisp at any magnification and embeds no image in a PDF, which makes it the better choice for print. And it is not bound by seamless tiling, so angle can be anything rather than one of 0, 45, 90, 135.
angles <- data.frame(
  angle = factor(c("15°", "40°", "65°", "115°", "160°"),
                 levels = c("15°", "40°", "65°", "115°", "160°")),
  h = 1
)

p <- vplot(angles, width = 7, height = 3.2) |>
  mark_bar(x = angle, y = h, pattern = angle) |>
  scale_pattern(values = list(
    pattern_hatch(angle = 15, spacing = 2.2),
    pattern_hatch(angle = 40, spacing = 2.2),
    pattern_hatch(angle = 65, spacing = 2.2),
    pattern_hatch(angle = 115, spacing = 2.2),
    pattern_hatch(angle = 160, spacing = 2.2)
  )) |>
  guides(pattern = "none") |>
  labs(title = "Vector hatch, at any angle you like", x = NULL, y = NULL)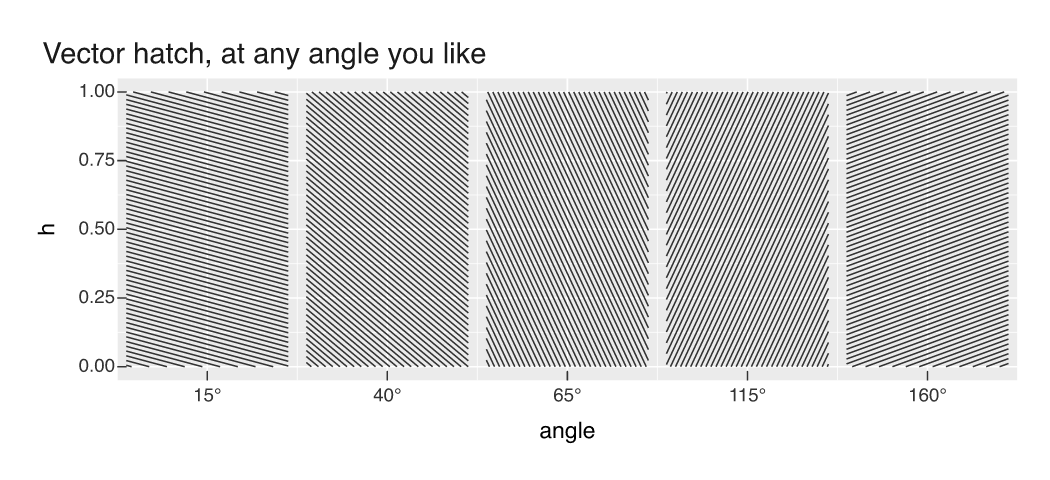
It takes the same color, bg, spacing, and linewidth arguments as the tile builders, and is used the same two ways: as a constant fill, or as a scale_pattern(values = ) entry. It is the “fix it” step of the accessibility workflow, where plot_lint() flags a problem and render_plot(cvd = ) shows it; a redundant non-colour encoding is what solves it.