d <- data.frame(
  x = mtcars$wt, y = mtcars$mpg,
  everything = "all cars"     # one level: an encoding that says nothing
)
note <- data.frame(x = 2.6, y = 33.5, label = "measured in 1974")

bad <- vplot(d, width = 7, height = 4.4) |>
  mark_point(x = x, y = y, color = everything, size = 2) |>
  mark_text(x = x, y = y, label = label, size = 11, color = "#e8e8e8",
            data = note) |>
  labs(title = "Weight against mileage", x = "wt", y = "mpg") |>
theme(axis.text = element_text(size = 3.2))Linting a figure before anyone sees it
Accessibility
plot_lint() reports the problems a green test suite hides: text below a legibility floor, contrast under the WCAG threshold, labels off the panel. render_plot(cvd = ) shows you a palette failing.
A plot cannot fail a test for being illegible. It renders, the file exists, the snapshot matches, and the 4-point axis text nobody can read ships anyway. The information needed to catch that is geometric: how many pixels tall is this glyph, what is behind that label. It exists in the scene before the render, so vellum can do static analysis on a figure the way a linter does on code.
This plot has several real problems, none of which stops it rendering:
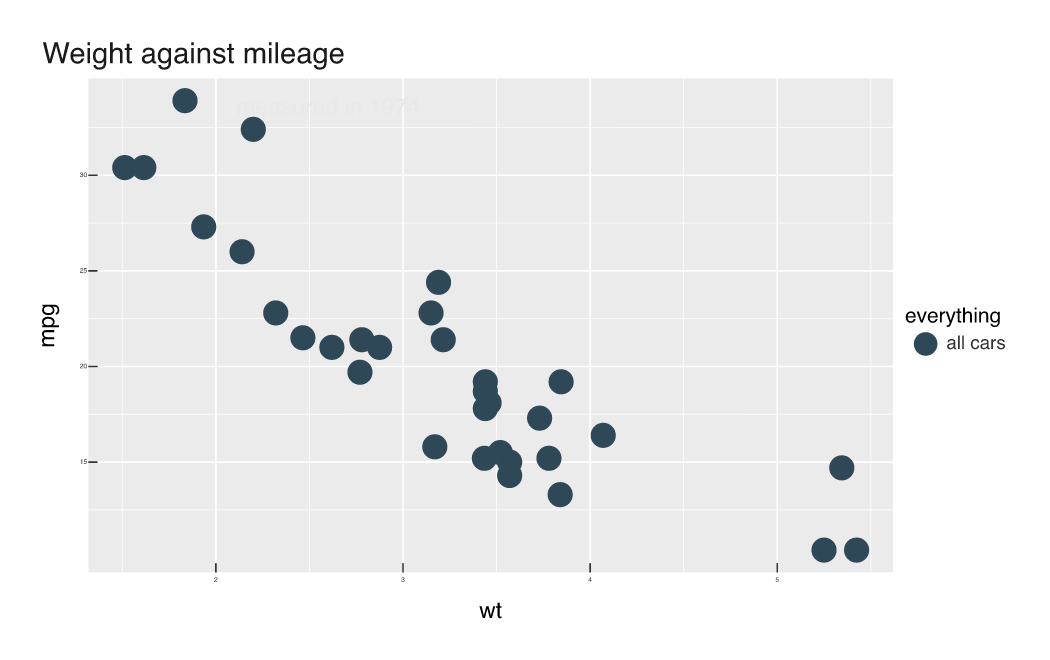
plot_lint() compiles it and says what is wrong, most severe first:
plot_lint(bad)
#> 10 lint findings (9 warnings):
#> ✖ [low_contrast] text: contrast 1.3:1 against its backdrop - below 3:1
#> ✖ [tiny_text] text: 4.3 px tall - below the 7 px legibility floor
#> ✖ [tiny_text] text: 4.3 px tall - below the 7 px legibility floor
#> ✖ [tiny_text] text: 4.3 px tall - below the 7 px legibility floor
#> ✖ [tiny_text] text: 4.3 px tall - below the 7 px legibility floor
#> ✖ [tiny_text] text: 4.3 px tall - below the 7 px legibility floor
#> ✖ [tiny_text] text: 4.3 px tall - below the 7 px legibility floor
#> ✖ [tiny_text] text: 4.3 px tall - below the 7 px legibility floor
#> ✖ [tiny_text] text: 4.3 px tall - below the 7 px legibility floor
#> ℹ [single_level_scale] scale:color: The color scale has a single level (all
#>   cars): the encoding conveys nothing and its legend is redundant.
A caption at 1.3:1 against the panel behind it, eight illegible tick labels, and a colour scale with one level: an encoding that carries no information and a legend that takes up space to say so. The result is a data frame, one row per finding (rule, severity, node, message), so it is as easy to assert on in a test as to read.
The geometric rules (text size, contrast, overlap, off-canvas) come from the engine vellum::vl_lint(), which judges them in resolved device pixels, so “too small” means too small at this figure’s size and dpi rather than below some nominal point value. The grammar-level rules are added on top from the trained scales: a single-level encoding, or a legend too long to read.
Both thresholds are arguments (min_text_px, min_contrast), so a figure headed for a projector can be held to a stricter floor than one for a printed page.
Fix the complaints and the linter goes quiet. Zero findings is the clean result:
good <- vplot(mtcars, width = 7, height = 4.4) |>
  mark_point(x = wt, y = mpg, color = hp, size = 2.2) |>
  mark_text(x = x, y = y, label = label, size = 11, color = "#3a2f1e",
            data = note) |>
  scale_color_continuous() |>
  labs(title = "Weight against mileage",
x = "weight (1000 lbs)", y = "miles per gallon", color = "hp")plot_lint(good)
#> ✔ No lint findings.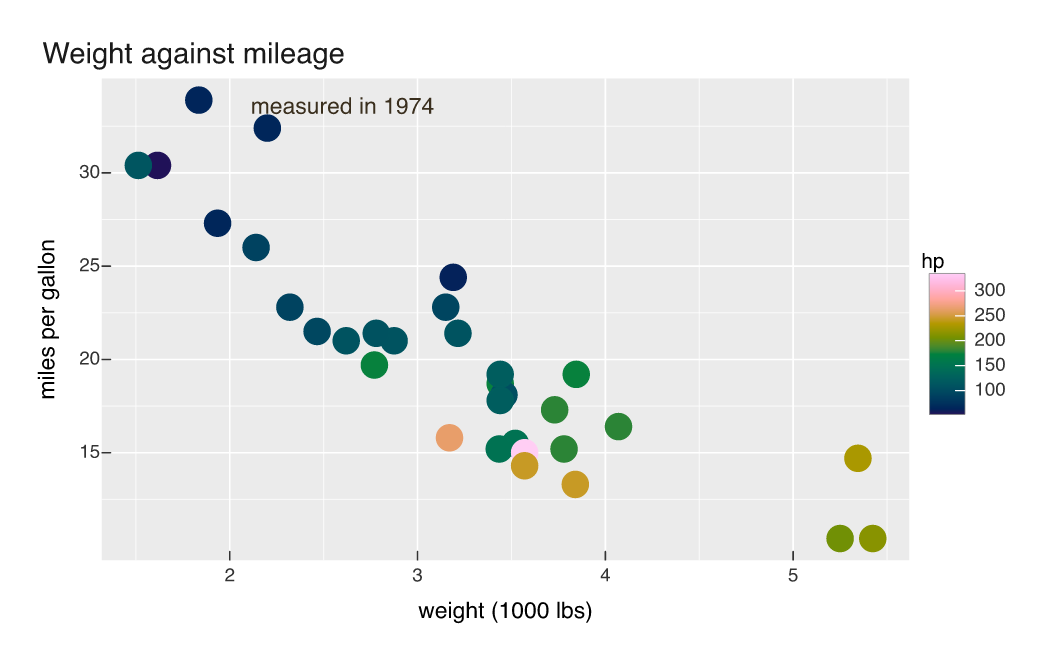
The engine’s own rules
Underneath, the same analysis works on a bare vellum scene, which is where the geometric rules are easiest to see. A watermark that will not contrast with what lands behind it, a mark drawn outside the page, and a label nobody could read:
library(vellum)
#>
#> Attaching package: 'vellum'
#> The following objects are masked from 'package:vellumplot':
#>
#>     linear_gradient, md, pdf_pages, radial_gradient, render_all,
#>     sketch, vl_pattern

vl_scene(4, 2, dpi = 96, bg = "white") |>
  draw(text_grob("n = 120", x = 0.1, y = 0.9, gp = vl_gpar(fontsize = 2.5),
                 name = "n_label")) |>
  draw(points_grob(2.4, 0.5, name = "stray_point")) |>
  draw(text_grob("watermark", gp = vl_gpar(fontsize = 22, col = "#F2F2F2"),
                 name = "watermark")) |>
  vl_lint()
#> 3 lint findings (3 warnings):
#> ✖ [low_contrast] watermark: contrast 1.4:1 against its backdrop - below 3:1
#> ✖ [offscreen] stray_point: drawn entirely outside the page - check the
#>   coordinates or the scale
#> ✖ [tiny_text] n_label: 3.3 px tall - below the 7 px legibility floor
None of those is a bug in the code that produced them. Each renders, passes its tests, and fails the reader, and that is the class of problem a linter is for.
Seeing a palette fail
The linter checks a mark against its backdrop, but it will not tell you that two of your series are the same colour to a red-green colour-blind reader. For that, render through a colour-vision-deficiency simulation. render_plot(cvd = ) takes "protanopia", "deuteranopia", "tritanopia", or "achromatopsia" and applies it to the raster, so you can look at the figure the way that reader will.
set.seed(4)
series <- data.frame(
  x = rep(1:20, 3),
  y = c(cumsum(rnorm(20, 0.3, 1)), cumsum(rnorm(20, 0.2, 1)), cumsum(rnorm(20, 0.1, 1))),
  series = rep(c("target", "actual", "forecast"), each = 20)
)

risky <- vplot(series, width = 6, height = 3.4) |>
  mark_line(x = x, y = y, color = series, linewidth = 1.4) |>
  scale_color_manual(values = c(target = "#c1121f", actual = "#4c9f38",
                                forecast = "#7a6a53")) |>
  labs(title = "Red, green, and brown", x = NULL, y = NULL, color = NULL)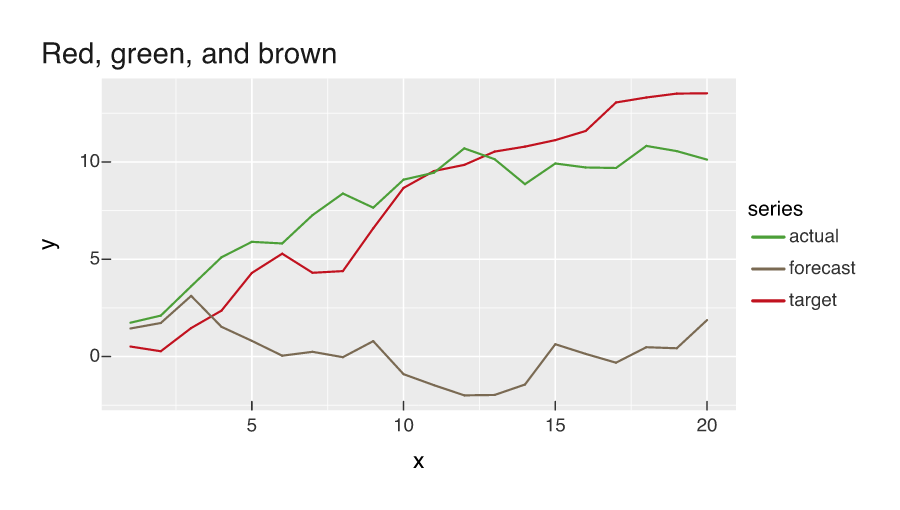
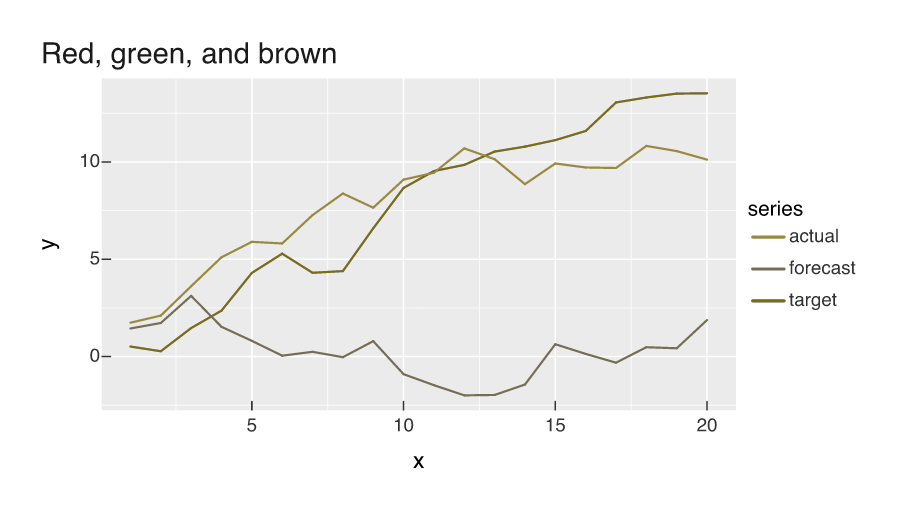
Red against green reads clearly until it does not, and the simulation is how you find out without asking a colleague to squint. The fix is a redundant encoding that does not depend on hue: see Hatched fills for greyscale, whose pattern_hatch() is real vector geometry, so it survives greyscale printing as well as colour blindness.
The three steps work together. plot_lint() flags the problem, render_plot(cvd = ) shows it, and pattern_hatch() or scale_pattern() fixes it. For what the figure ships with once it is right, see Alt text that ships with the plot.