p <- vplot(pen) |>
  mark_point(x = flipper_length_mm, y = body_mass_g, color = species, size = 2) |>
  labs(title = "Flipper length vs. body mass",
x = "flipper length (mm)", y = "body mass (g)", color = "species")Alt text that ships with the plot
Accessibility
Every vellumplot writes a text alternative into the file it renders: role=“img” and a in SVG, a tagged Figure in PDF. plot_alt() shows you what a screen reader will read.
A chart with no text alternative is invisible to anyone using a screen reader. Most plotting libraries leave that gap for you to fill by hand, so in practice it stays empty. vellumplot fills it by default: every plot carries a written description, and that description travels into the rendered file.
The data is the 333 complete Palmer Penguins.
What a screen reader gets
plot_alt() returns the description vellumplot will attach. You did not write one, so it built the sentence from the specification: the chart type, what each axis and the colour encode, and how many observations went in.
plot_alt(p)
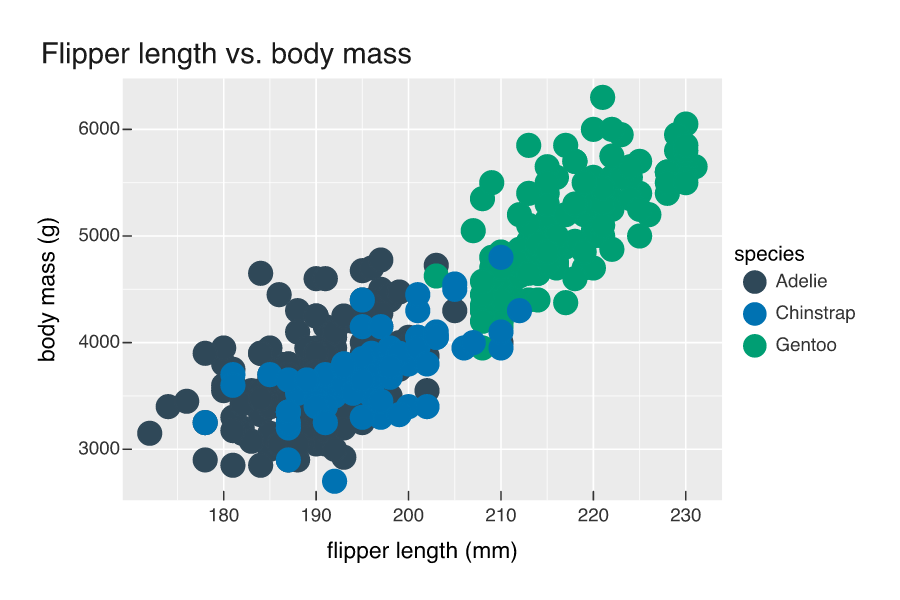
#> [1] "A scatter plot. It plots body mass (g) (vertical axis) against flipper length (mm) (horizontal axis), where colour shows species. Based on 333 observations."
That summary is honest but mechanical. It reports the encoding, not the finding. When the point of the chart is a pattern, write the pattern yourself with labs(alt = ...) and vellumplot uses your text verbatim.
p <- p |>
  labs(alt = paste(
    "Body mass rises with flipper length across all three penguin species.",
    "Gentoo penguins cluster in the upper right as the largest on both",
    "measures, while Adelie and Chinstrap overlap in the lower left."
  ))

plot_alt(p)
#> [1] "Body mass rises with flipper length across all three penguin species. Gentoo penguins cluster in the upper right as the largest on both measures, while Adelie and Chinstrap overlap in the lower left."
It ends up in the file
The description is not metadata you have to remember to export. When the plot renders, it goes into the file. An SVG gets role="img" and an aria-labelledby that points at the title and the description, so assistive technology reads the title as the chart’s name and the <desc> as its content.
#> <svg xmlns="http://www.w3.org/2000/svg" width="900" height="600" viewBox="0 0 900 600" role="img" aria-labelledby="vl111-t vl111-d">
#>   <title id="vl111-t">Flipper length vs. body mass</title>
#>   <desc id="vl111-d">Body mass rises with flipper length across all three penguin species. Gentoo penguins cluster in the upper right as the largest on both measures, while Adelie and Chinstrap overlap in the lower left.</desc>
#>   ...
#> </svg>
The title comes from labs(title = ...) and becomes the accessible name; the <desc> is whatever plot_alt() returns. Render the same plot to PDF and the chart is tagged as a Figure whose Alt is that text, which is what a PDF reader announces and what a tagging checker looks for.
Because the description comes from the spec, you can read it back in R, in the console, before anything is drawn. So you can review it, or test it, the way you would any other output.
testthat::expect_match(plot_alt(p), "flipper length")The summary follows the plot
Change the structure of the plot and the generated description changes with it. Split the same scatter across islands with facet_wrap() and the last sentence now names the faceting variable, so the auto text stays true to what is drawn even when you have not written any alt text of your own.
p_facet <- vplot(pen) |>
  mark_point(x = flipper_length_mm, y = body_mass_g, color = species, size = 1.6) |>
  facet_wrap(~island) |>
  labs(title = "Body mass by island",
       x = "flipper length (mm)", y = "body mass (g)", color = "species")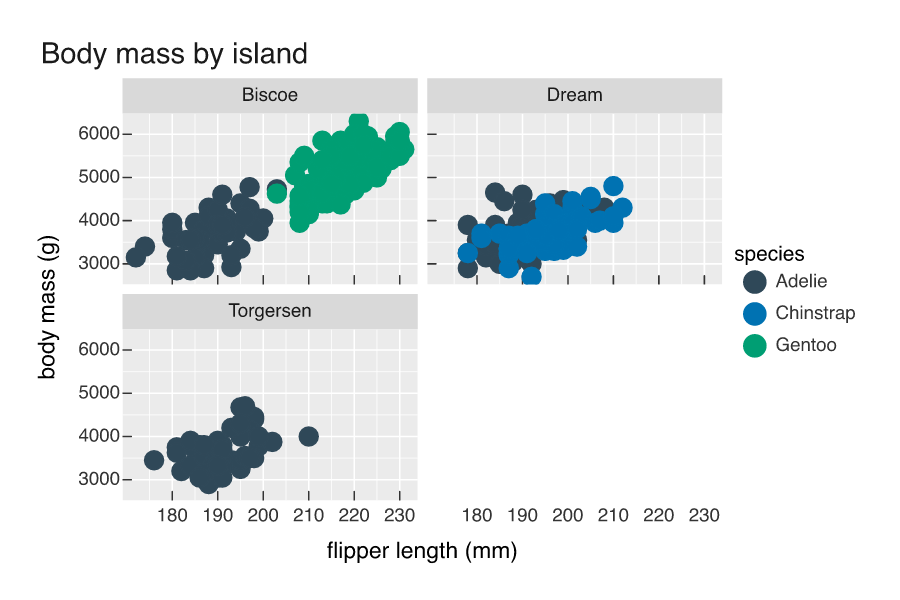
plot_alt(p_facet)
#> [1] "A scatter plot. It plots body mass (g) (vertical axis) against flipper length (mm) (horizontal axis), where colour shows species. Based on 333 observations. Faceted by island."
The facets carry a fact the pooled scatter hid: Gentoo turns up only on Biscoe, Torgersen holds nothing but Adelie, and Dream mixes Adelie with Chinstrap. That is the kind of thing a labs(alt = ...) string should say, since the generated sentence reports the layout but not what the layout reveals.
See the Accessibility article in the vellumplot docs for more details.