library(gapminder)

g <- transform(as.data.frame(gapminder), gdp = pop * gdpPercap / 1e9)
biggest <- head(g[g$year == 2007, ][order(-g$gdp[g$year == 2007]), "country"], 10)

d <- g[g$country %in% biggest, c("country", "year", "gdp")]
d$country <- droplevels(factor(d$country))
d <- do.call(rbind, lapply(split(d, d$year), function(s) {
  s$rank <- rank(s$gdp, ties.method = "first")
  s
}))

# One row per state, for the year stamp.
stamp <- data.frame(year = sort(unique(d$year)), rank = 2, gdp = 12000)

head(d[d$year == 1952, ], 3)
#>          country year      gdp rank
#> 1952.169  Brazil 1952 119.3716    2
#> 1952.289   China 1952 222.7550    4
#> 1952.529 France 1952 298.4834 7A bar chart race, with no new API
Animation
transition_states() over a rank column turns mark_bar() into a bar chart race: bars keyed by category slide past each other as their ranks change, on frozen scales.
A bar chart race is a ranking that reorders itself over time. There is no mark_race(): it falls out of mark_bar(), coord_flip() and transition_states(), because the tween engine keys each bar to its category and interpolates position as well as length. When two categories swap rank, their bars slide past each other.
The one thing the data has to carry is the rank. Bar position comes from the x encoding, so ranking within each year and mapping x = rank is what makes bars move; map x = country instead and you get twelve years of bars growing in place.
Ten countries, twelve five-year steps, and a rank from 1 (smallest) to 10 (largest) recomputed inside each year.
a <- vplot(d, width = 7, height = 4.5, dpi = 150) |>
  mark_bar(x = rank, y = gdp, fill = country) |>
  mark_text(x = rank, y = gdp, label = country, hjust = 0, size = 3.6) |>
  mark_text(x = rank, y = gdp, label = year, data = stamp, size = 13, color = "grey70") |>
  coord_flip() |>
  guides(fill = "none") |>
  scale_y_continuous(limits = c(0, 16000)) |>
  theme(axis.text.y = element_blank(), axis.ticks.y = element_blank()) |>
  transition_states(year, transition_length = 1, state_length = 2) |>
  labs(title = "Total GDP, the ten largest economies of 2007",
       x = NULL, y = "billions of 1990 dollars") |>
  animate(nframes = 72, fps = 14)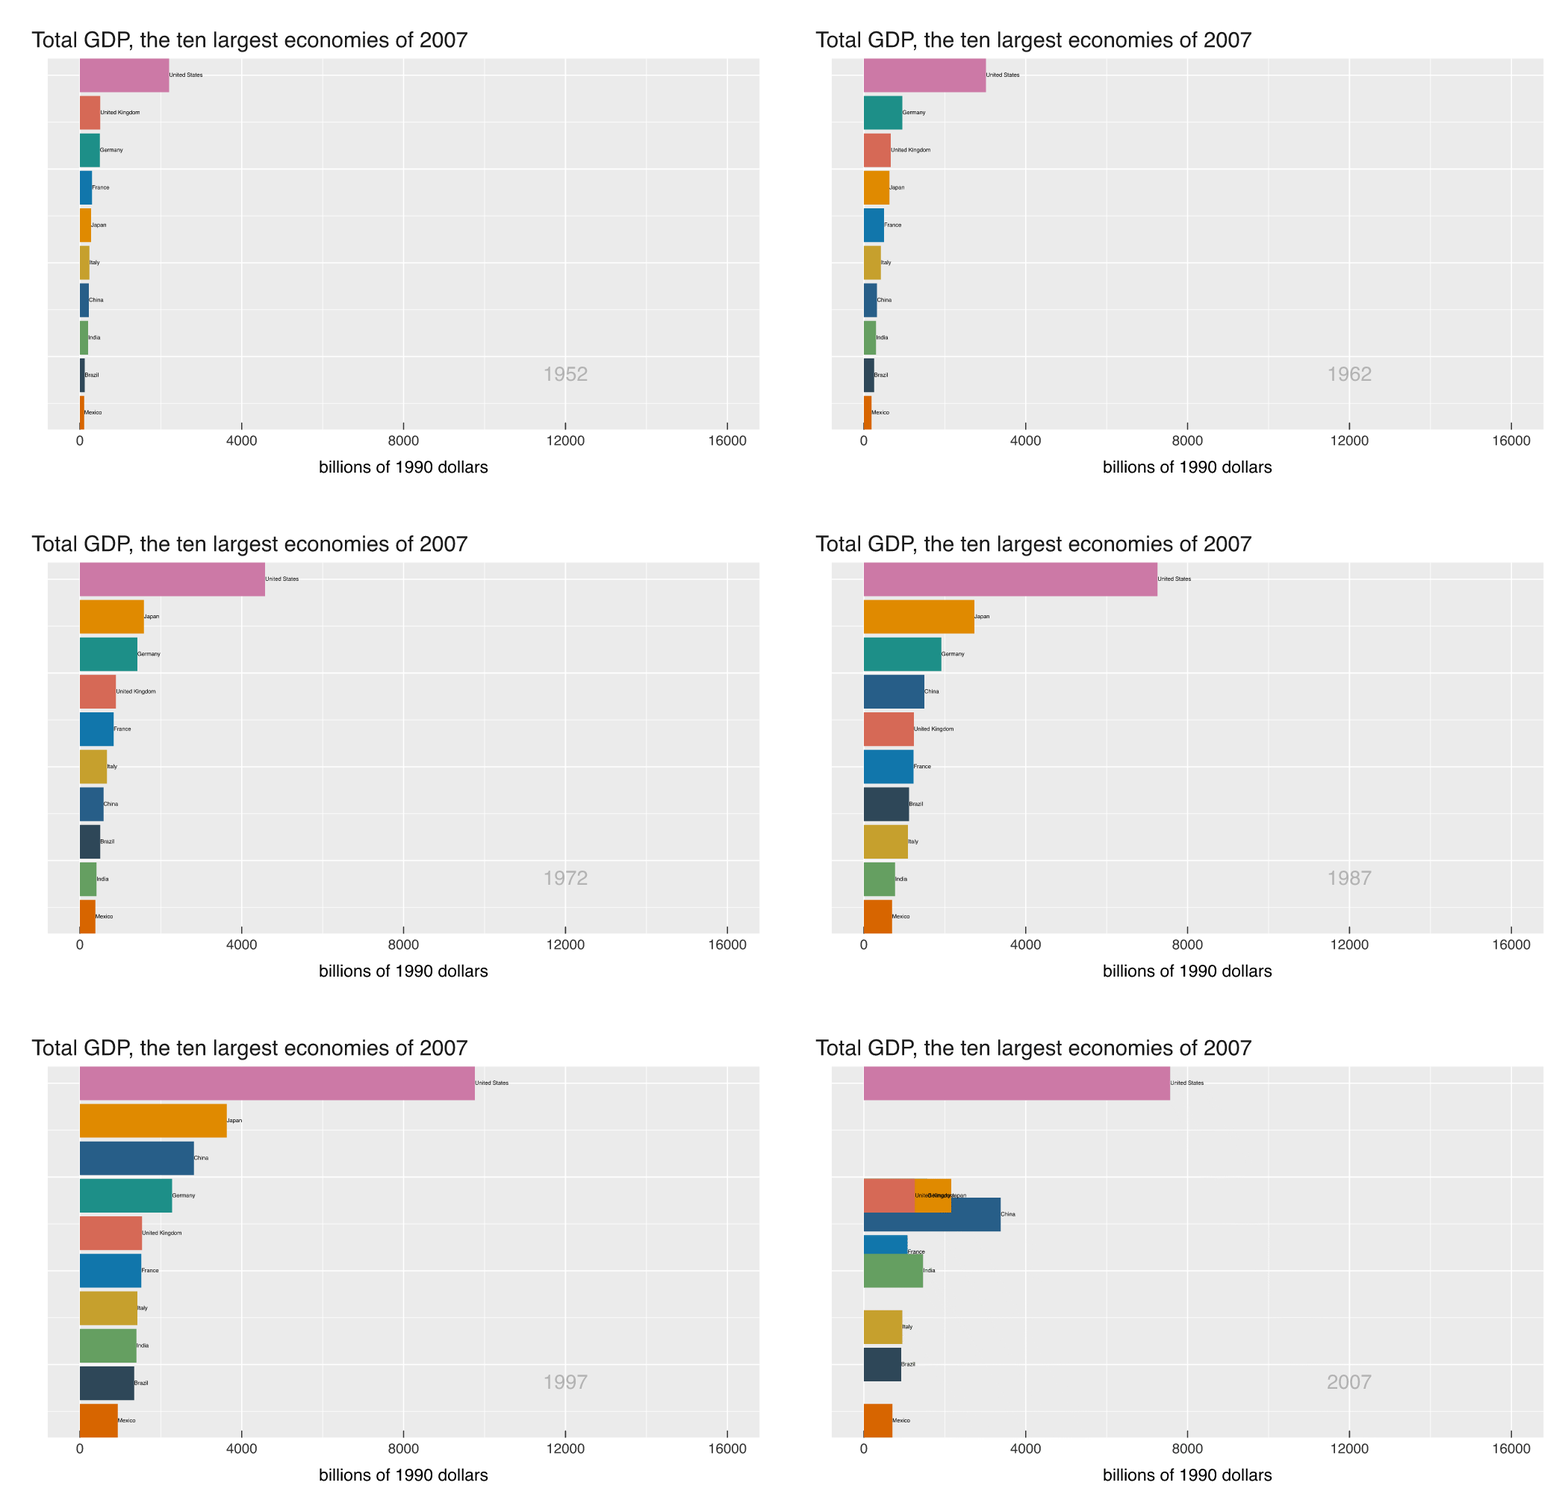
China starts seventh of the ten and takes second place off Japan in 2002. Japan had climbed to second in 1972 and held it through five steps. India sits eighth as late as 1997, then passes the United Kingdom, France and Germany to reach fourth by 2007. The United States never moves. Labels ride their bars, so you can follow one country through the reshuffling instead of re-reading the axis every time the order changes.
What the engine is doing
Bars interpolate on two channels at once. Length follows gdp, and position follows rank, so a country whose rank changes by one slides one slot while its bar grows. The scales were trained once across all twelve years and frozen, which is why the axis never jumps: 1952 is drawn against the same 16000-billion axis as 2007, and the growth is legible as growth rather than as a rescaling.
transition_length and state_length set the rhythm. The 1:2 ratio here holds each year twice as long as the slide into it, which leaves the ranking readable at rest and still shows the overtakes. Setting state_length = 0 gives constant motion with nothing to read.
The year stamp is a mark_text() layer over its own twelve-row table, one row per state. A layer’s own data = is filtered to the current keyframe whenever it carries the state column, so each frame stamps one year; a layer whose data has no year column would instead persist unchanged through the whole animation, which is what you want for a caption or a reference line.
GIF, for once
The output is a GIF, which is the right choice here and the wrong one for the Gapminder bubbles. GIF allows 256 colours per frame; this animation uses ten flat fills, a grey panel and some text, so nothing is lost, and the file stays small enough to sit in a page. Antialiased bubbles over a smooth colour ramp are the opposite case, and that page uses an APNG. The third option, .svg, is in An animation with no pixels in it.