p <- vplot(mtcars) |>
  mark_point(x = wt, y = mpg, color = hp) |>
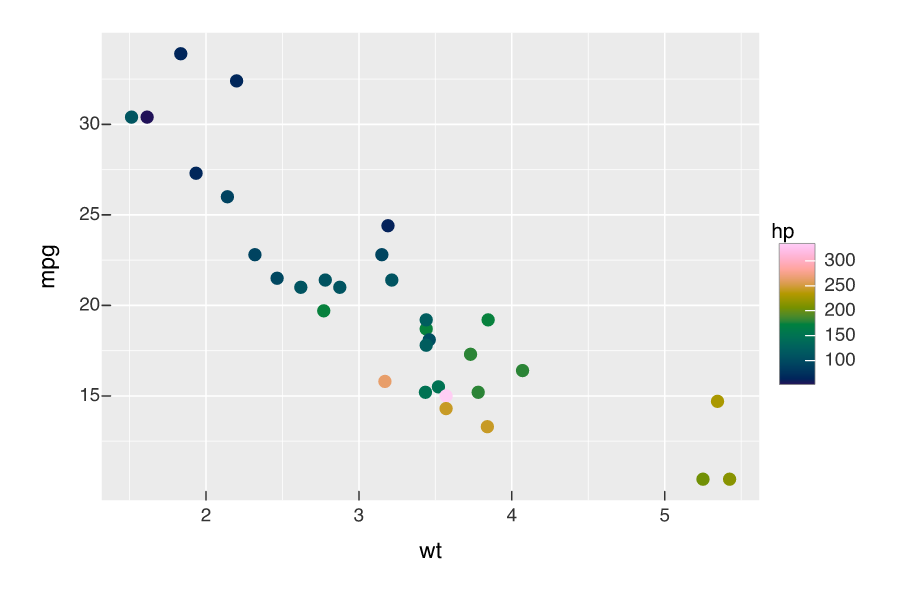
scale_color_continuous()Scatter with a continuous colour legend
Basics
A point mark encoding a third variable to colour, with a trained continuous scale and guide.
Every plot starts from a data frame with vplot(), then adds marks with the native pipe. Here a mark_point() encodes hp to colour, and scale_color_continuous() trains the scale and draws the guide.