peng <- na.omit(datasets::penguins)

p <- vplot(peng) |>
  mark_point(x = bill_len, y = body_mass, color = species, alpha = 0.5) |>
  mark_smooth(x = bill_len, y = body_mass, method = "lm", se = TRUE) |>
  labs(title = "Linear smooth with confidence band",
x = "bill length (mm)", y = "body mass (g)")Layered marks: points and a smooth
Basics
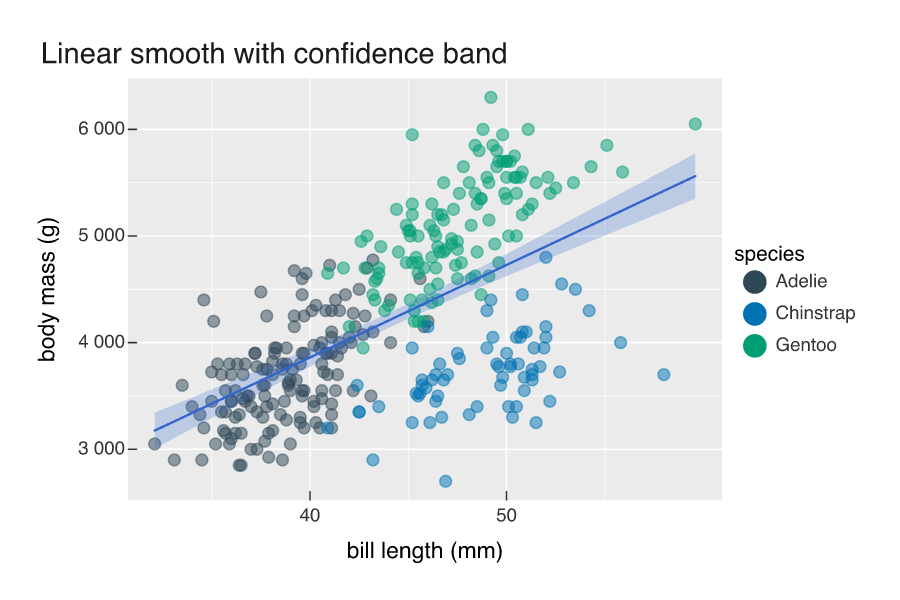
Two marks over the same data: a scatter and a linear smooth with a confidence band.
Marks stack in the order you pipe them. Here a mark_point() layer is drawn first, then a mark_smooth() fits a linear model and draws its confidence band on top.