set.seed(42)

signal <- vplot(data.frame(t = 1:120, v = 40 + cumsum(rnorm(120, 0.1, 1.4)))) |>
  mark_area(
    x = t, y = v,
    fill = linear_gradient(c("#08F7FE", "#08F7FE00"), x1 = 0, y1 = 1, x2 = 0, y2 = 0)
  ) |>
  mark_line(x = t, y = v, color = "#08F7FE", effects = list(glow(size = 5))) |>
  labs(title = "SIGNAL", x = NULL, y = NULL) |>
  theme_cyberpunk()

clusters <- vplot(datasets::iris) |>
  mark_point(
    x = Petal.Length, y = Petal.Width, color = Species, size = 2,
    effects = list(glow(size = 3))
  ) |>
  labs(title = "CLUSTERS", x = NULL, y = NULL, color = NULL) |>
  theme_cyberpunk()

counts <- vplot(as.data.frame(table(cyl = factor(mtcars$cyl)))) |>
  mark_bar(x = cyl, y = Freq, fill = cyl) |>
  labs(title = "COUNTS", x = NULL, y = NULL) |>
  theme_cyberpunk()

density <- vplot(faithful) |>
  mark_density(x = eruptions, fill = "#FE53BB", color = "#FE53BB", alpha = 0.5) |>
  labs(title = "DENSITY", x = NULL, y = NULL) |>
  theme_cyberpunk()

p <- concat(
  signal, clusters, counts, density,
  design = "
    AAB
    AAC
    DDC
  "
)Cyberpunk dashboard
Composition
Effects
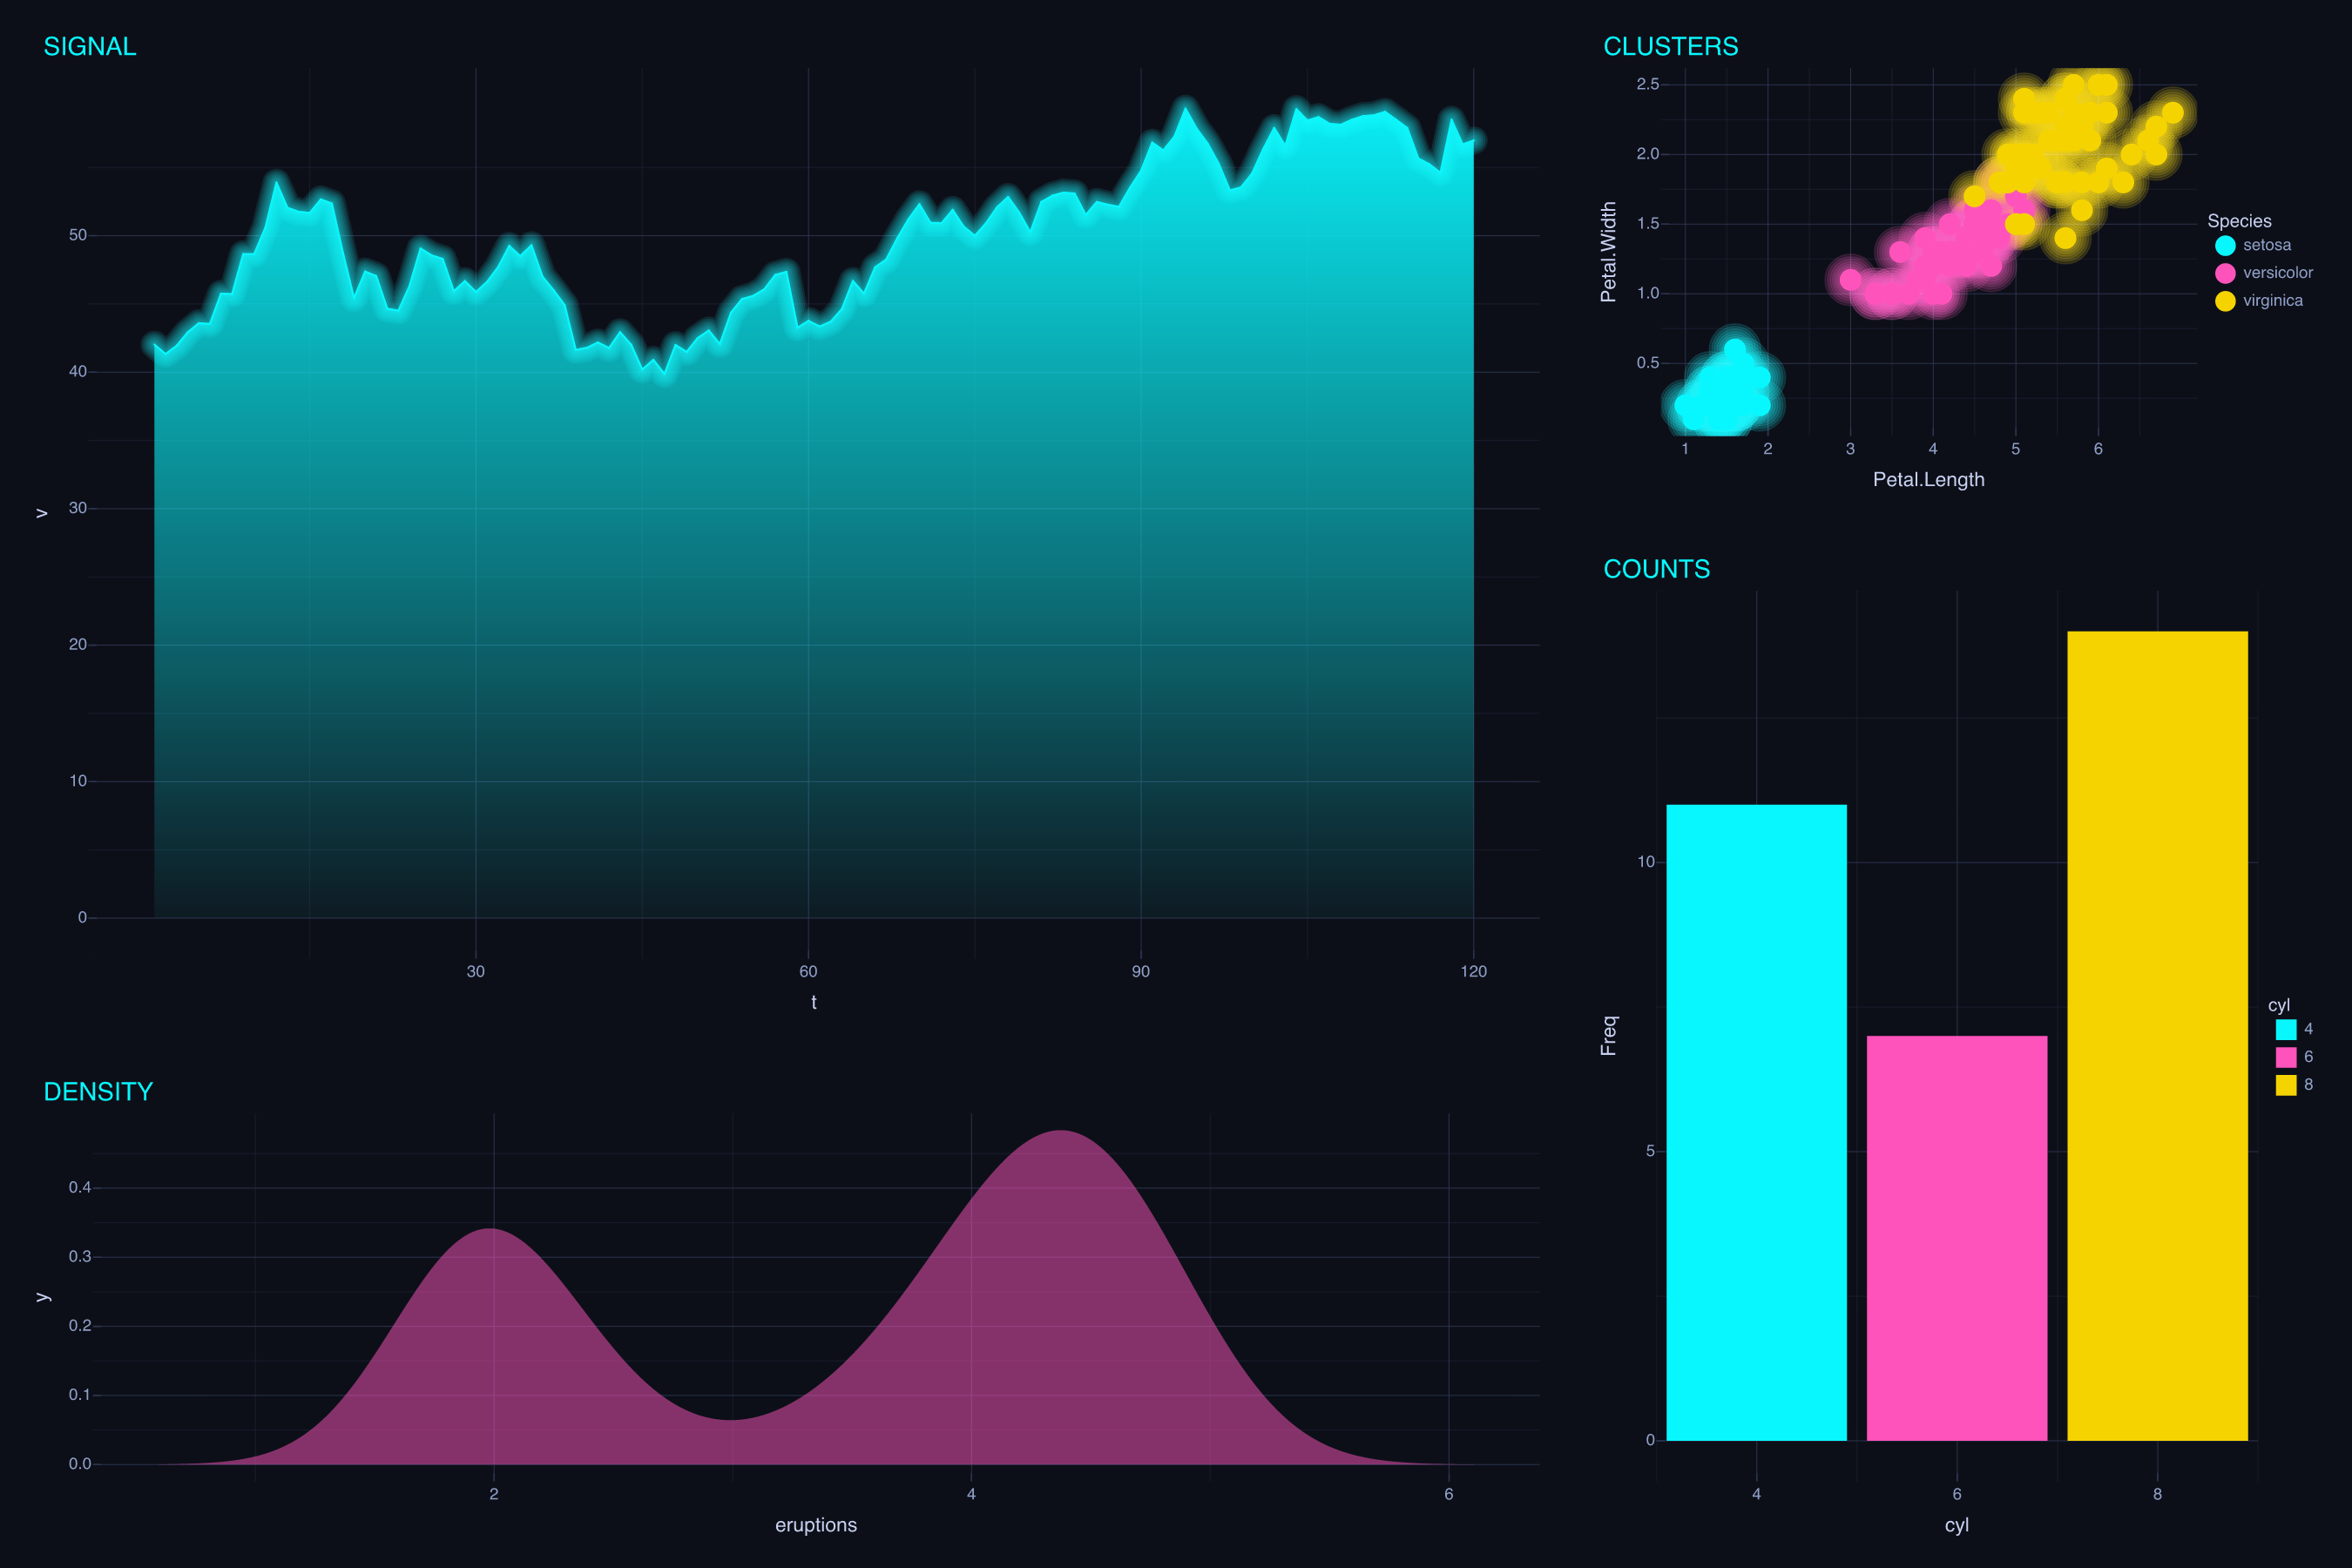
Four neon panels composed into one dark dashboard with a design string, glowing lines, and a gradient area fill.
Composition and layer effects combine into a dashboard. Each panel is an ordinary plot under theme_cyberpunk(), and concat() arranges them with a design string: SIGNAL fills a two-by-two block on the left, COUNTS runs down the right, and CLUSTERS and DENSITY take the remaining cells. Because the theme paints every panel on the same near-black canvas, the seams disappear.
glow() haloes the stroked and point marks (the line and the scatter); it does not apply to bars or filled areas, so those lean on the neon palette and a linear_gradient() fill instead.