flows <- data.frame(
  from = c(
    "Coal", "Gas", "Nuclear", "Hydro", "Wind",
    "Grid", "Grid", "Grid",
    "Residential", "Industry", "Commercial"
  ),
  to = c(
    "Grid", "Grid", "Grid", "Grid", "Grid",
    "Residential", "Industry", "Commercial",
    "Losses", "Losses", "Losses"
  ),
  value = c(24, 18, 20, 8, 12, 32, 28, 22, 6, 9, 5)
)

p <- vsankey(
  flows, from, to, value,
  show_values = TRUE,
  flow_color = "gradient"
) |>
labs(title = "Energy supply to end use")Sankey diagram
Flows
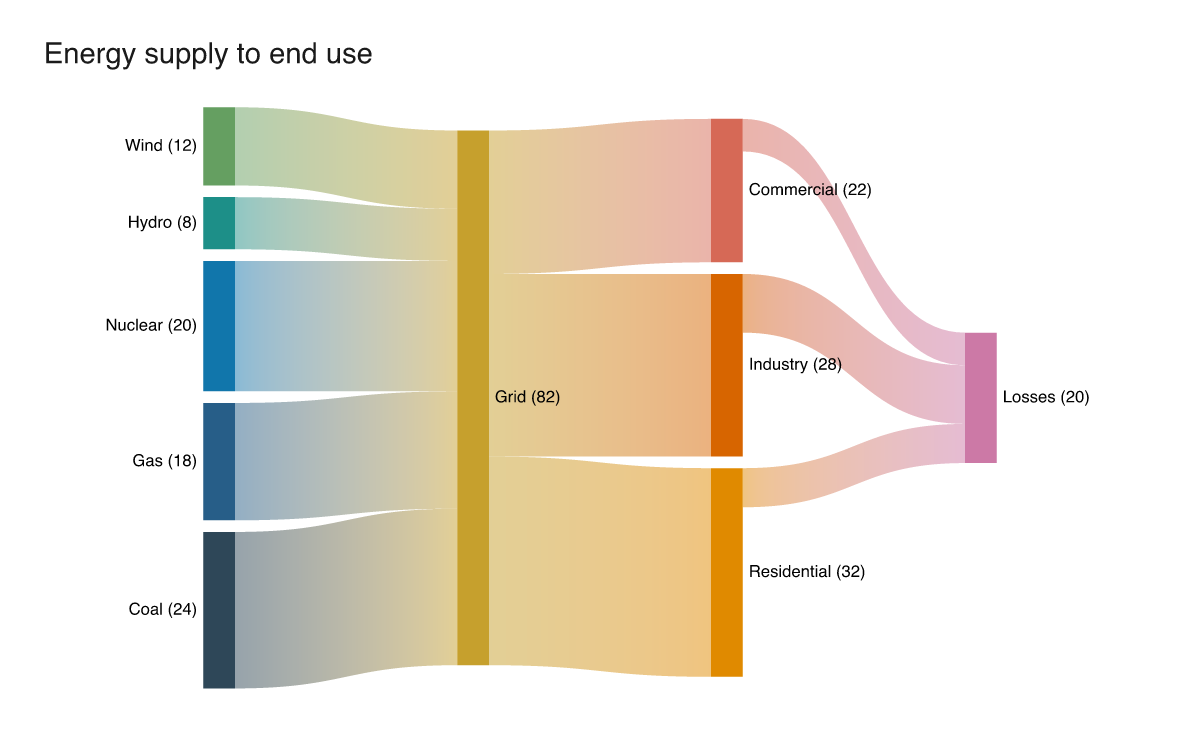
A multi-stage energy-flow diagram, with ribbons that fade from their source colour to their target.
vsankey() builds a layered flow diagram from a flow list: one row per flow with a from node, a to node, and a value (the ribbon width). Nodes are the union of from/to, layered by longest path and ordered within each column to minimise ribbon crossings.
Setting flow_color = "gradient" fades each ribbon from its source node’s colour to its target’s, so a flow’s origin and destination both read at a glance.