g <- igraph::make_graph("Zachary")
g <- igraph::set_vertex_attr(
  g, "grp",
  value = as.factor(igraph::cluster_louvain(g)$membership)
)
g <- igraph::set_vertex_attr(g, "deg", value = igraph::degree(g))

p <- vgraph(g, layout = "stress") |>
  mark_edges(alpha = 0.4) |>
  mark_nodes(size = deg, fill = grp) |>
  scale_size(range = c(1, 3)) |>
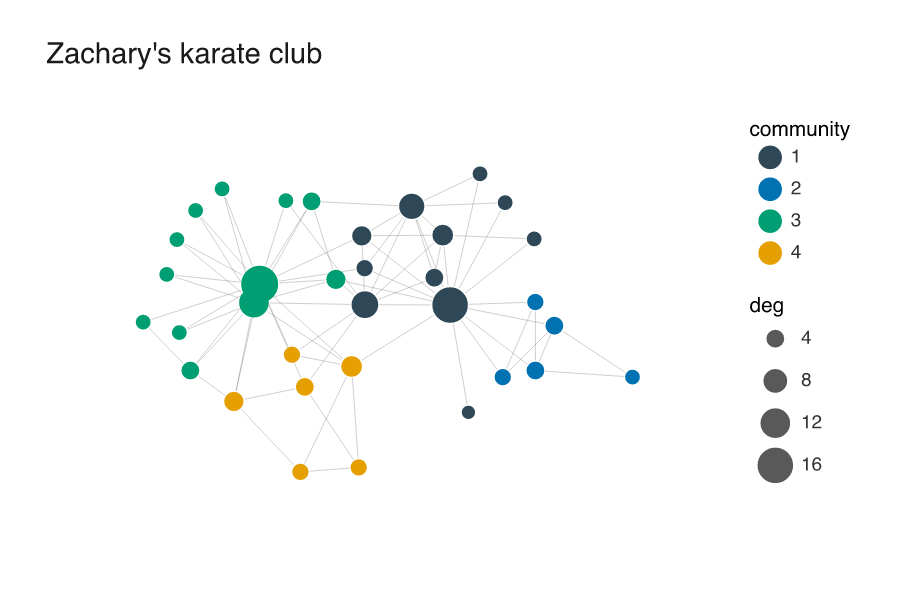
labs(title = "Zachary's karate club", fill = "community")Network diagram
Networks
A node-link diagram from an igraph graph, laid out with a stress layout.
vgraph() starts a plot from an igraph graph and computes a layout (stress by default). mark_edges() and mark_nodes() then draw the graph, with node attributes mapped to size and fill.