cm <- cor(mtcars[, c("mpg", "disp", "hp", "drat", "wt", "qsec")])
hm <- expand.grid(v1 = rownames(cm), v2 = colnames(cm))
hm$cor <- as.vector(cm)

p <- vplot(hm) |>
  mark_tile(x = v1, y = v2, fill = cor) |>
  scale_fill_gradient(low = "#b2182b", high = "#2166ac") |>
labs(title = "Correlation matrix (tiles)", x = NULL, y = NULL)Correlation matrix
Heatmaps
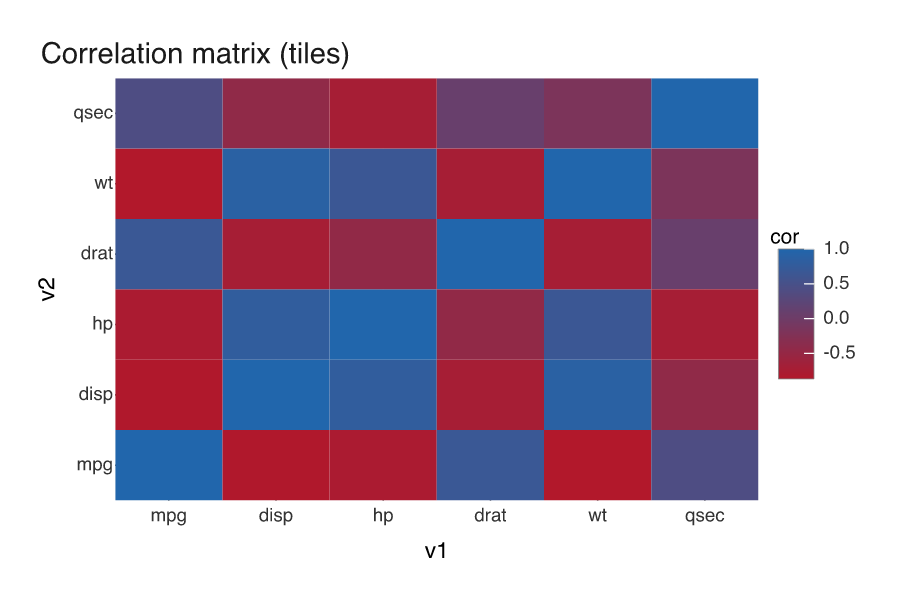
A heatmap of a correlation matrix drawn with tile marks and a diverging fill scale.
Reshape a correlation matrix to long form and draw it with mark_tile(), then map the correlation to a diverging scale_fill_gradient().