peng <- na.omit(datasets::penguins)

p <- vplot(peng) |>
  mark_point(x = bill_len, y = body_mass, color = species, size = 2) |>
  labs(
    title = md("**Body mass** of *Pygoscelis* penguins"),
    subtitle = md("Axis titles carry markup too: **bold**, *italic*, super/subscript"),
    y = md("Body mass (kg x 10^3^)"),
    x = md("Bill length (*mm*)"),
    color = "Species"
)Rich text labels with md()
Text
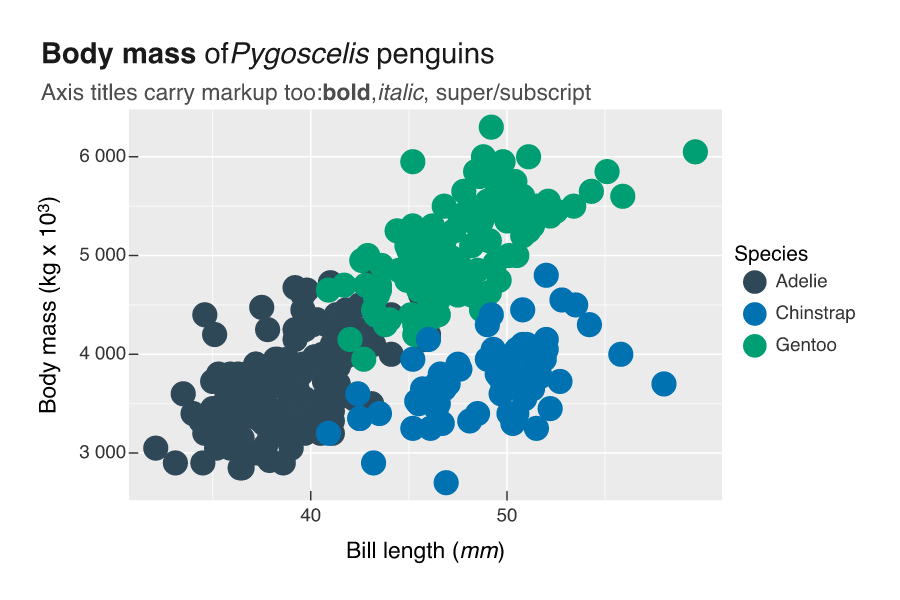
Markdown markup in titles and axis names: bold, italic, superscript, and subscript via md().
Wrap a label in md() and it accepts a small slice of Markdown: **bold**, *italic*, ^superscript^, and ~subscript~. It works anywhere a label does, including plot titles, subtitles, and axis names. Superscripts and subscripts earn their keep on units and formulae, like m2 or CO2.