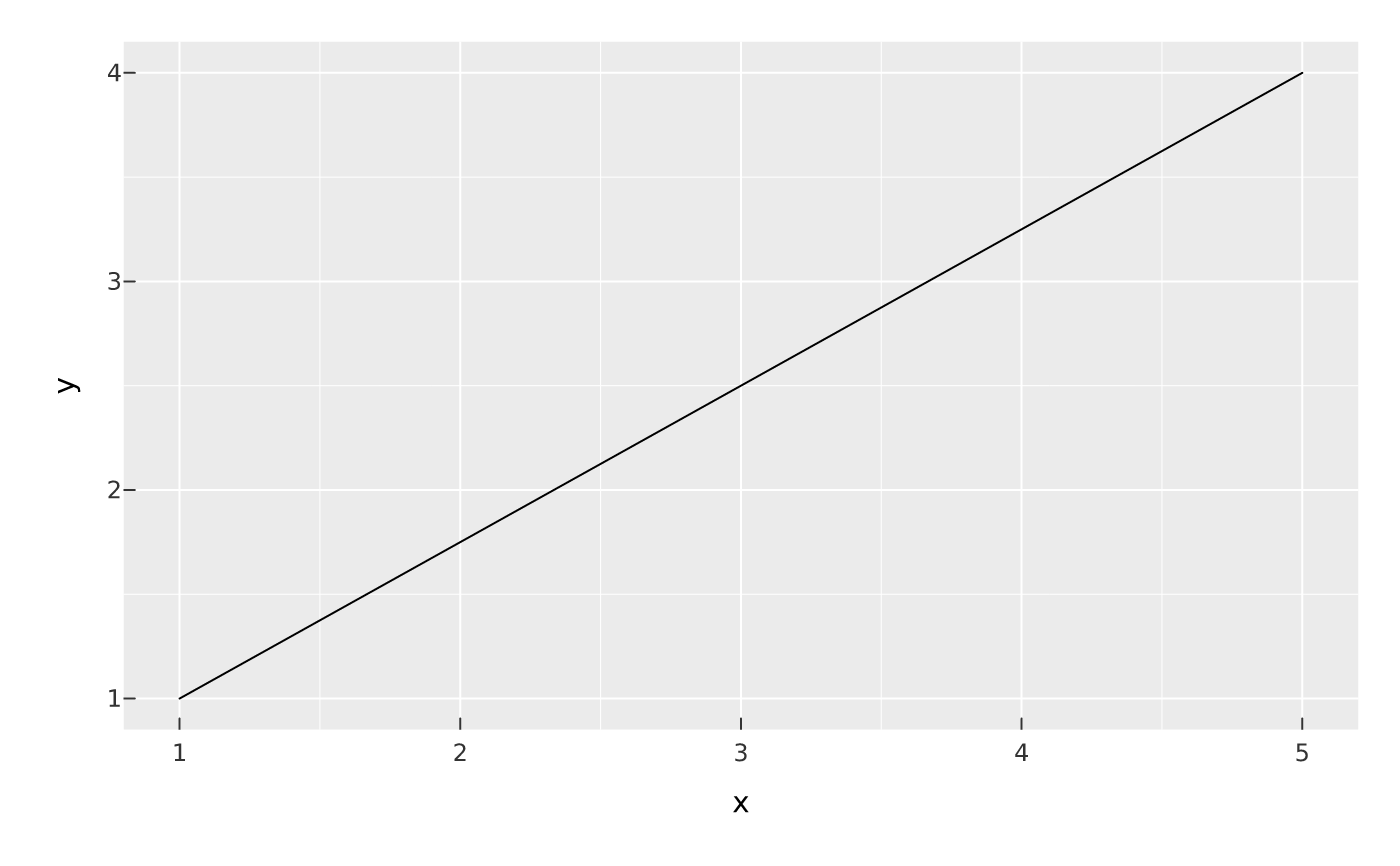
mark_segment() draws a straight line from (x, y) to (xend, yend) per row.
Usage
mark_segment(
  plot,
  ...,
  auto = FALSE,
  blend = NULL,
  effects = list(),
  sketch = NULL,
  data = NULL
)
Arguments
- plot
- ...
Encodings (tidy-eval):
x,y,xend,yend(+color,linewidth,linetype,alpha). A mappedlinewidthgives each segment its own width – seescale_linewidth().- auto
For
mark_point(),mark_line(),mark_step(),mark_segment(), andmark_edges(), whenTRUEand the layer has very many rows, automatically render it as a datashaded density raster (seemark_datashade()) instead of individual vector marks: points bin into a density grid (vellum::datashade()), dense lines/steps rasterise as connected polylines (vellum::datashade_lines()), and segments/edges as independent segments (vellum::datashade_segments()). The datashaded line/segment output isdynspread-ed so thin marks stay visible (see thespreadargument ofmark_datashade()). The fallback is skipped under a warped coordinate system (coord_polar()/coord_trans()), which draws the vector marks instead.- blend
Optional blend mode for compositing this layer against what is already drawn beneath it (the panel and earlier layers), one of the CSS
mix-blend-modenames, e.g."multiply","screen","darken". The whole layer composites as one isolated group (not per element).- effects
A list of layer render effects applied to the mark at draw time —
glow(),outline(), andshadow(). Available on stroked and point marks.- sketch
A
sketch()spec giving this layer a hand-drawn look (wobbly outlines, hachure fills),NA/FALSEto force it crisp (overriding a plot-widetheme_sketch()), orNULL(default) to inherit. Geometry marks accept it; text, raster, hex and datashade marks do not.- data
Optional layer data frame; overrides the plot data for this layer.
Value
The modified PlotSpec.
Examples
d <- data.frame(x = 1, y = 1, xend = 5, yend = 4)
vplot(d) |> mark_segment(x = x, y = y, xend = xend, yend = yend)