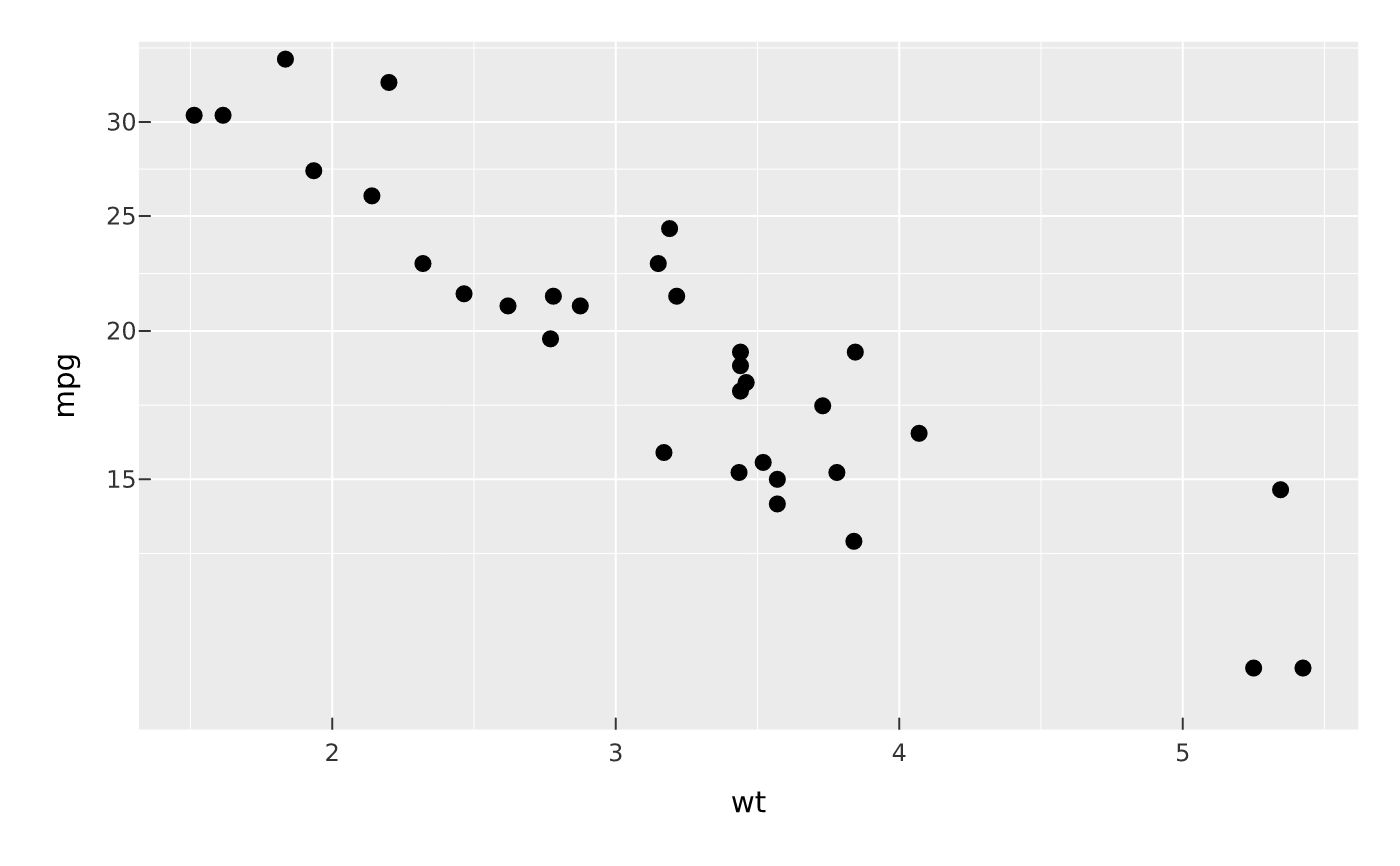
coord_trans() applies a nonlinear transform to the display of one or both
position axes, after the scale has trained. This differs from a
scale_*(trans=): a scale transform rescales the data and picks its breaks in
the transformed space (so a log scale is labelled 1, 10, 100), whereas
coord_trans() keeps the trained breaks at their original data values and only
warps where they are drawn — so the axis is still labelled with the raw
values, the gridlines bunch up, and straight lines curve. Use it to show data
on, say, a log display without relabelling the axis in powers of ten.
Arguments
- plot
A PlotSpec.
- x, y
Display transform for that axis (default
"identity").
Value
The modified PlotSpec.
Details
The transform is separable per axis. Each of x/y is a transform name
("identity", "log10", "sqrt") or a scales::transform_*() object. It is
intended for continuous position axes; "reverse" is better expressed as
scale_*(trans = "reverse").
Examples
vplot(mtcars) |> mark_point(x = wt, y = mpg) |> coord_trans(y = "log10")