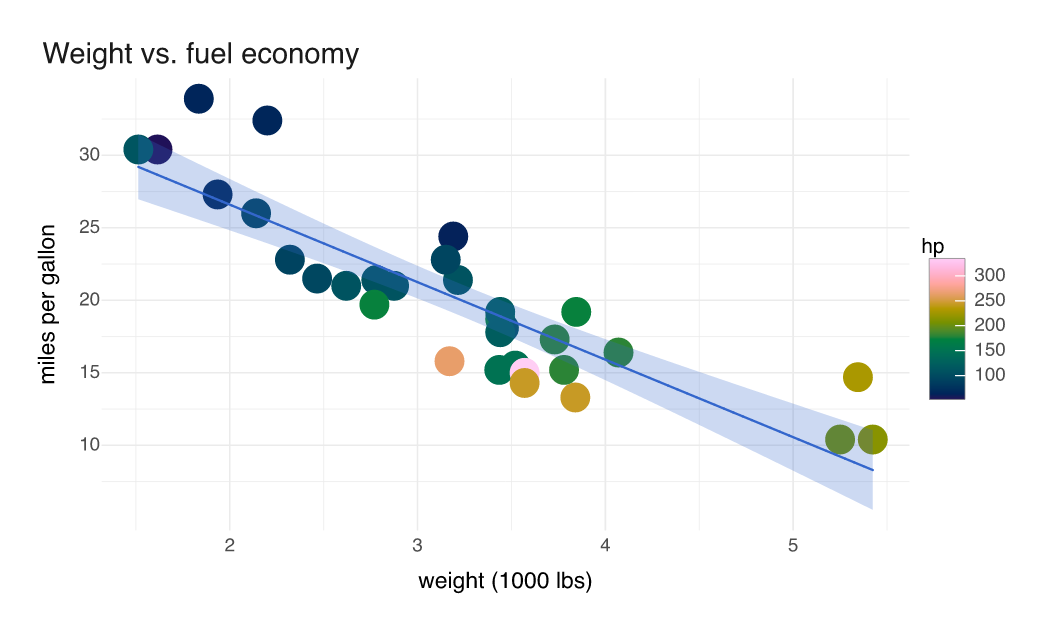
p <- vplot(mtcars, width = 7, height = 4.2) |>
  mark_point(x = wt, y = mpg, color = hp, size = 2.4) |>
  mark_smooth(x = wt, y = mpg, method = "lm", se = TRUE) |>
  scale_color_continuous() |>
  labs(
    title = "Weight vs. fuel economy",
    x = "weight (1000 lbs)", y = "miles per gallon", color = "hp"
  ) |>
  theme_minimal()
vellum gallery
The parchment, the pen, and the annotation revealed on the page.
A showcase of what you can draw with the vellum graphics ecosystem in R. Its engine measures text and solves layout before anything reaches a canvas, so a figure is something you can interrogate, lint, hash, and hand to a browser rather than a sheet of pixels. The grammar sits on top; the widget reads the same solved scene.
The ecosystem
vellum
the parchment
A low-level graphics framework in the spirit of grid. Text is measured and layout solved with no device open, so the scene can say where every element landed before it is drawn.

vellumplot
the pen
A declarative, pipe-first grammar of graphics. A plot is an inspectable, serializable spec until it compiles into a vellum scene.

vellumwidget
the annotation
Hosts a vellum scene in the browser (hover, select, brush, zoom) by reading the solved geometry instead of re-drawing the plot in a second engine.

vellumverse
the meta-package
Installs and loads the whole ecosystem together, in the spirit of the tidyverse.
A taste
A data frame, a few marks, and a trained scale make a whole plot.
See the rest in the gallery.