vplot() begins a declarative, pipe-first plot. It captures the data and
page size and returns an inspectable PlotSpec; nothing is drawn until the
spec is compiled (via render_plot() or vellum::as_vellum_scene()). Build
the plot up with mark_point() / mark_line() / mark_rule() and the
scale_*() functions.
Arguments
- data
A data frame. Encoding expressions in
mark_*()are evaluated against it with tidy evaluation.- width, height
Page size in inches.
- dpi
Output resolution in dots per inch. The exported PNG's pixel dimensions are
width * dpibyheight * dpi; raisingdpiyields a denser image at the same physical size. Overridable at render time viarender_plot()'sdpiargument.
Value
A PlotSpec.
Examples
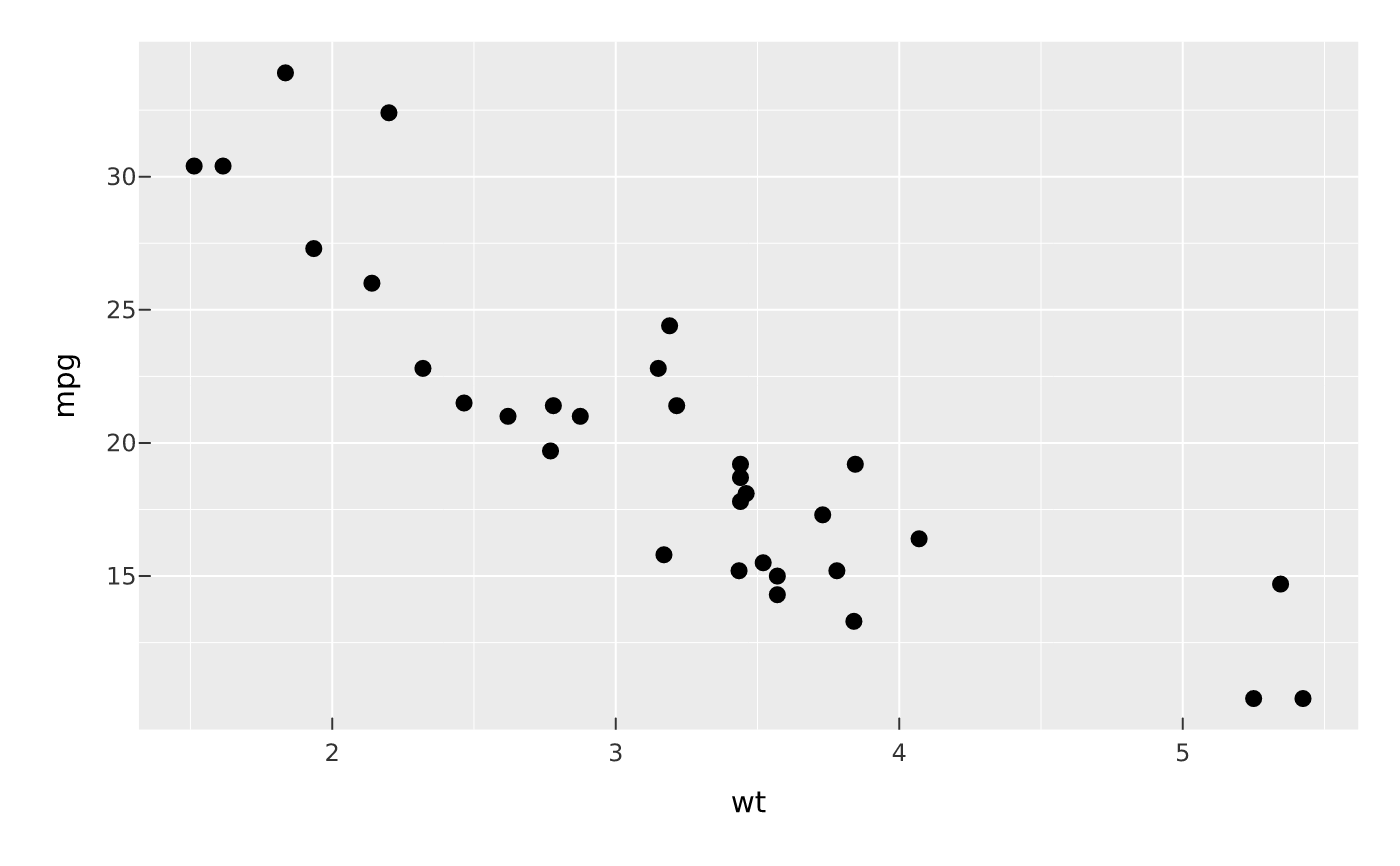
vplot(mtcars) |> mark_point(x = wt, y = mpg)