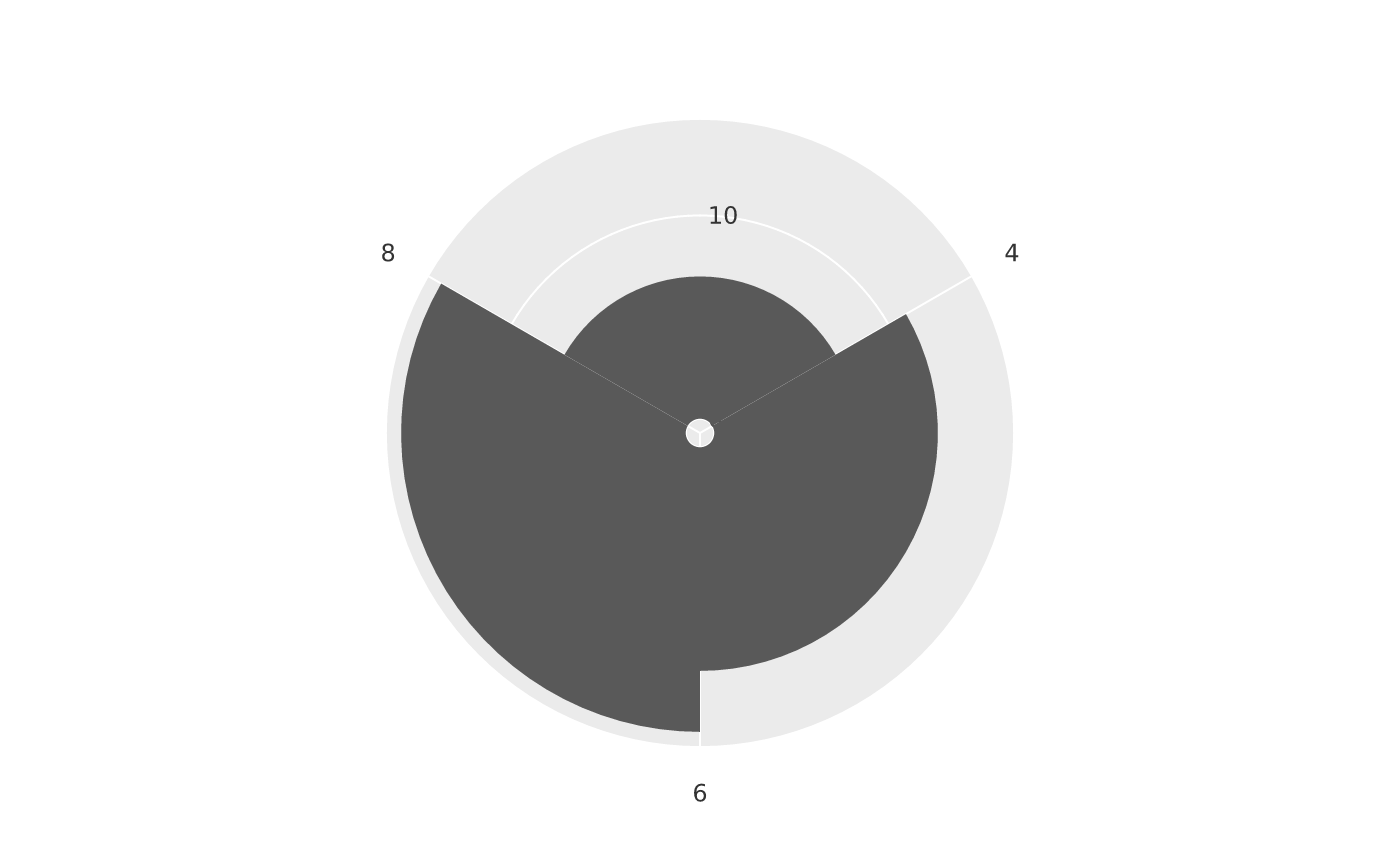
coord_polar() projects the panel into polar space: one position aesthetic
becomes the angle and the other the radius. With theta = "x" (the default)
the x aesthetic maps to angle and y to radius — a categorical bar chart
becomes a wind-rose / coxcomb, a line becomes a radar/spider trace, a point
cloud is positioned by (angle, radius). With theta = "y" a stacked bar
becomes a pie (see also the mark_pie() / mark_donut() shortcuts). The
panel is locked to a square. Lines, areas, and ribbons are interpolated into
smooth arcs.
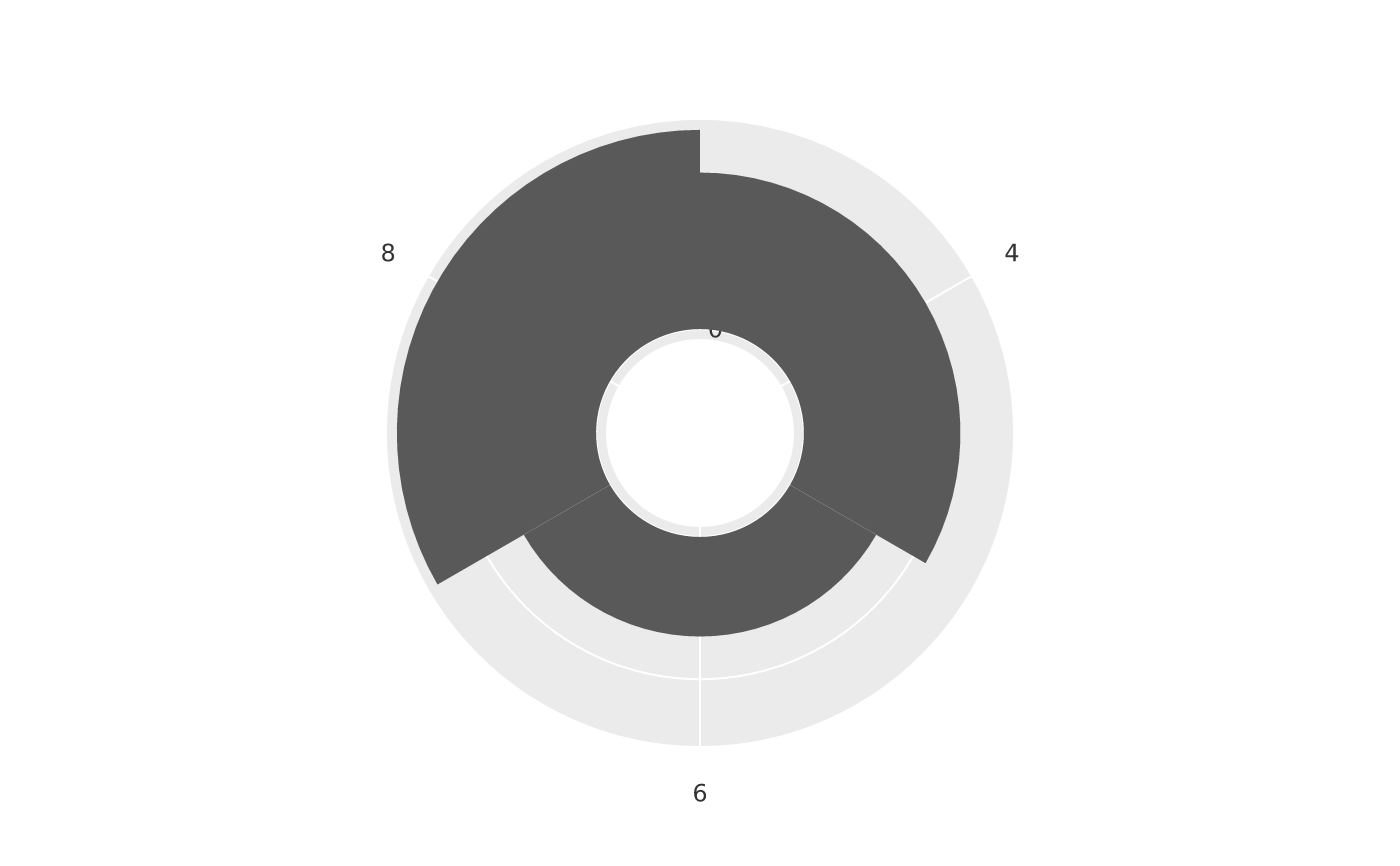
coord_radial() is a fuller polar system (ggplot2 3.5's name): besides
theta/start/direction it takes end to sweep only a partial arc
(e.g. a half-circle gauge) and inner_radius to open a donut hole. With
end = NULL and inner_radius = 0 it is identical to coord_polar().
Usage
coord_polar(plot, theta = "x", start = 0, direction = 1)

coord_radial(
  plot,
  theta = "x",
  start = 0,
  end = NULL,
  direction = 1,
  inner_radius = 0
)
Arguments
- plot
A PlotSpec.
- theta
Which position aesthetic drives the angle:
"x"(default) or"y".- start
Angular offset of the zero position, in radians (
0places the first value at twelve o'clock).- direction
Winding direction:
1for clockwise (default),-1for counter-clockwise.- end
Arc end angle in radians;
NULL(default) sweeps a full turn fromstart. Set it for a partial arc — e.g.start = -pi/2, end = pi/2for a semicircular gauge.- inner_radius
Radius of the central hole as a fraction of the outer radius (
0–1);0(default) is a filled disc,> 0a donut/ring.
Value
The modified PlotSpec.