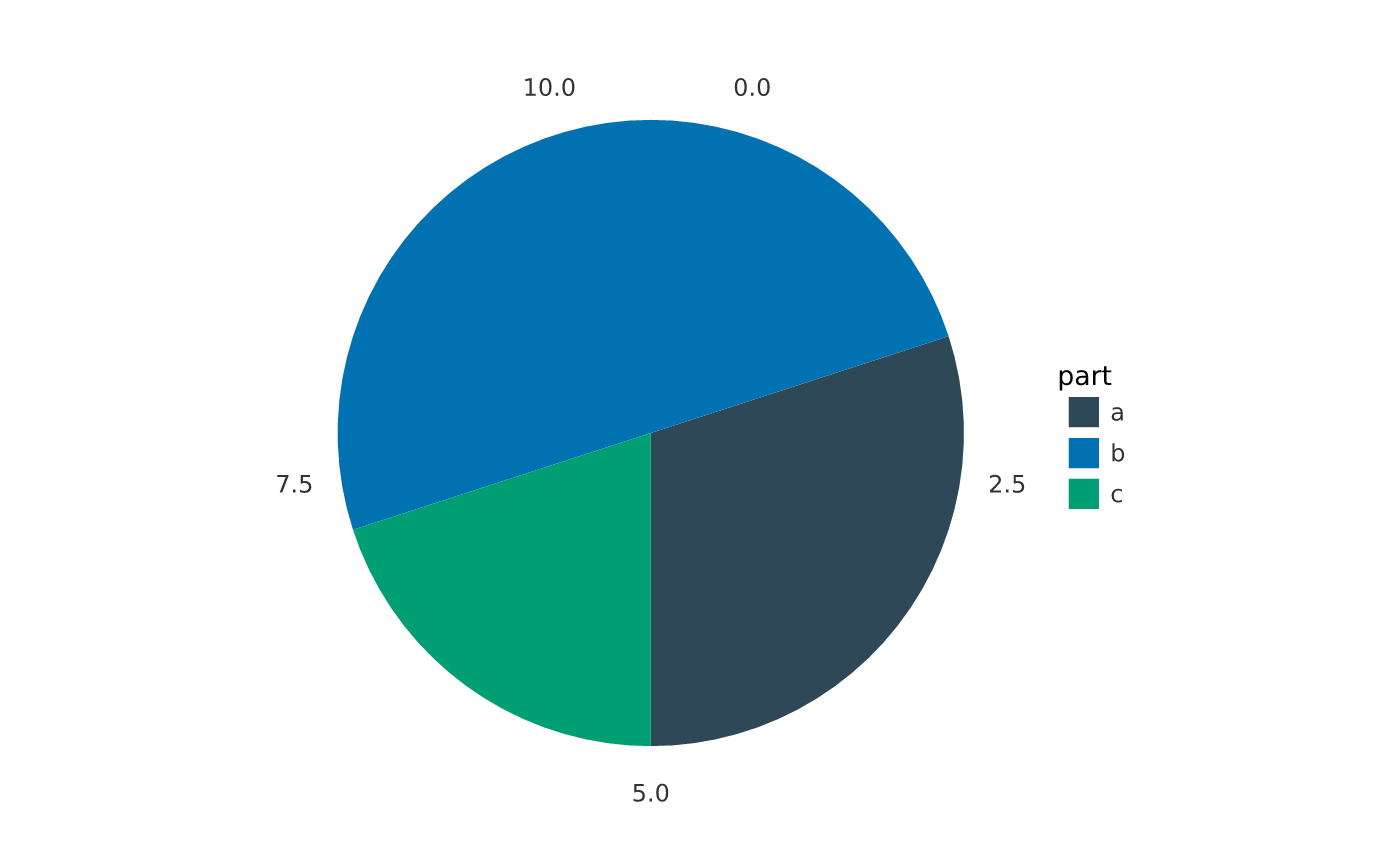
Convenience marks for part-of-whole charts. mark_pie() draws a pie: each
value becomes a wedge whose angle is its share of the total, coloured by
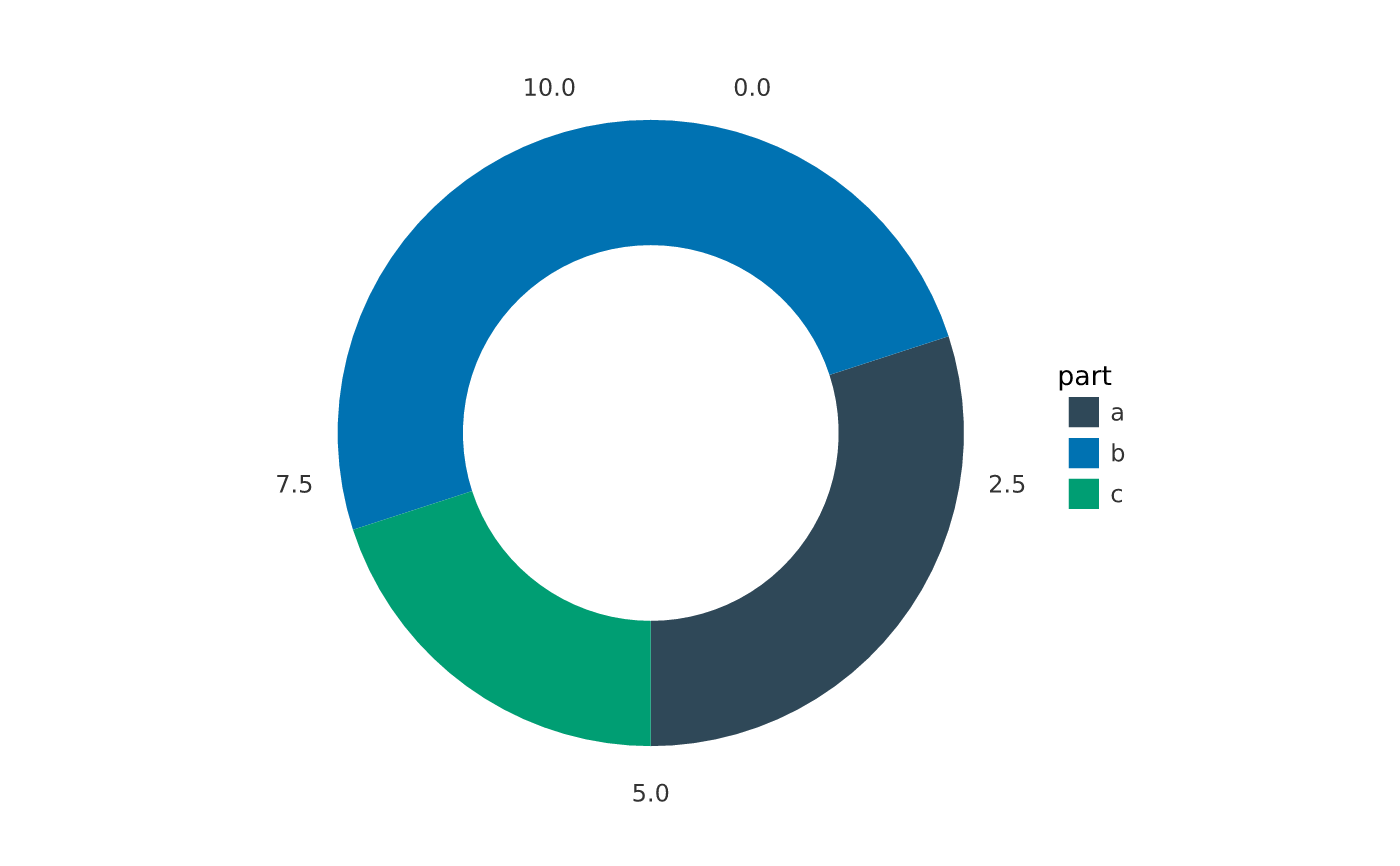
fill. mark_donut() is a pie with a hollow centre (inner_radius, a
fraction of the radius). Both are shorthand for a stacked bar projected through
coord_polar() with theta = "y", which they set on the plot; they error if
the plot already carries a non-polar coordinate.
Usage
mark_pie(
  plot,
  value,
  fill = NULL,
  ...,
  blend = NULL,
  sketch = NULL,
  data = NULL
)

mark_donut(
  plot,
  value,
  fill = NULL,
  inner_radius = 0.5,
  ...,
  blend = NULL,
  sketch = NULL,
  data = NULL
)
Arguments
- plot
A PlotSpec.
- value
Encoding (tidy-eval) for each slice's magnitude.
- fill
Encoding (tidy-eval) for the slice colour. Omit for a single slice.
- ...
Further constant aesthetics (e.g.
alpha).- blend
Optional blend mode for compositing the layer (see
mark_point()).- sketch
A
sketch()spec giving the layer a hand-drawn look, orNULL(default) to inherit.- data
Optional per-layer data frame.
- inner_radius
For
mark_donut(), the inner-hole radius as a fraction of the rim (0is a pie, the default0.5a medium donut).
Value
The modified PlotSpec.
Examples
df <- data.frame(part = c("a", "b", "c"), n = c(3, 5, 2))
vplot(df) |> mark_pie(value = n, fill = part)
 vplot(df) |> mark_donut(value = n, fill = part, inner_radius = 0.6)