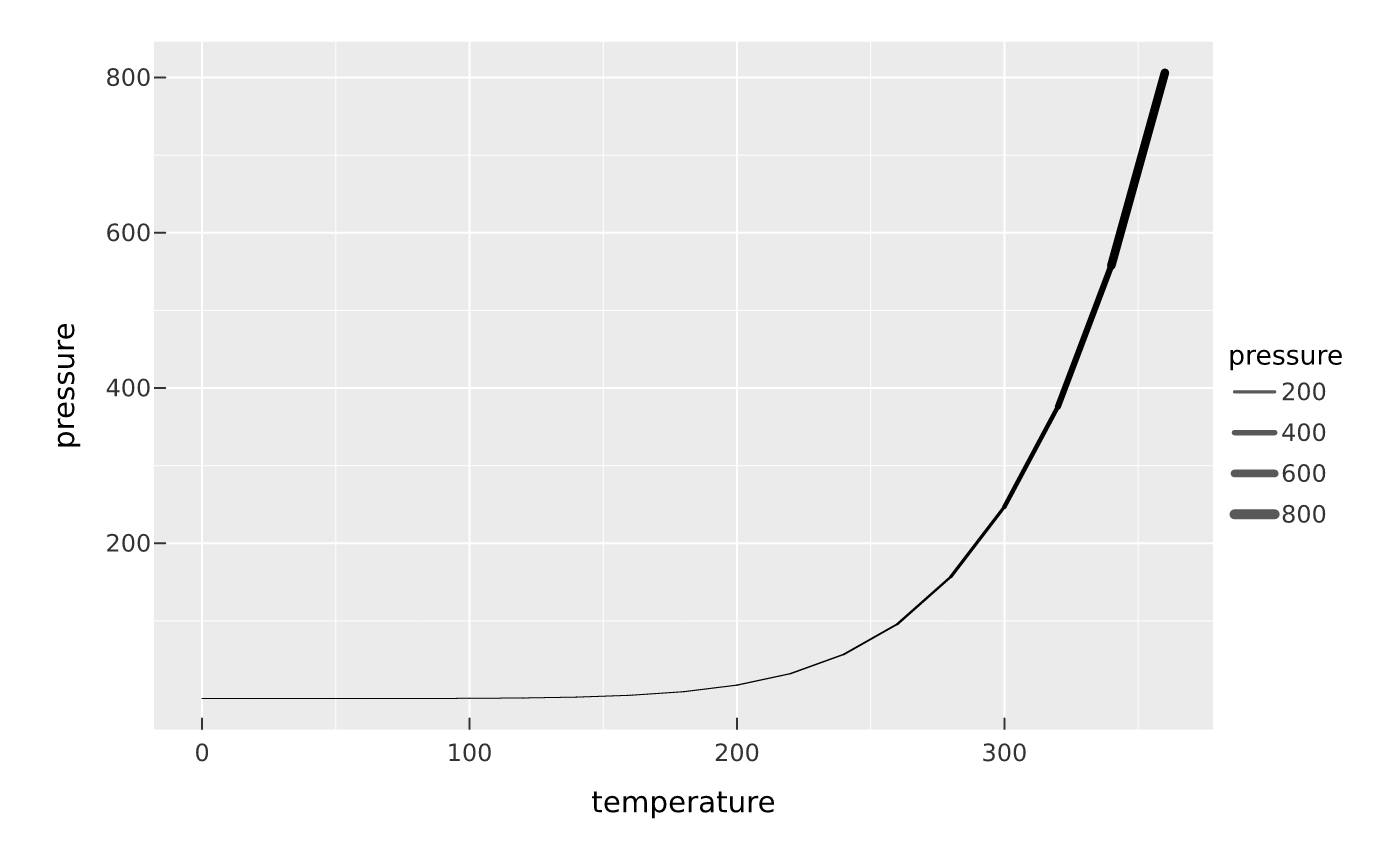
Declare the scale for a mapped linewidth aesthetic on a stroked mark –
mark_line(), mark_step(), or mark_segment(). Data values are rescaled
linearly onto a line-width range (in lwd units, as everywhere else in the
package) and a line-width legend is drawn automatically.
Usage
scale_linewidth(plot, range = NULL, limits = NULL, breaks = NULL, name = NULL)

scale_linewidth_continuous(
  plot,
  range = NULL,
  limits = NULL,
  breaks = NULL,
  name = NULL
)
Arguments
- plot
A PlotSpec.
- range
Output line-width range
c(min, max), orNULLfor the defaultc(0.5, 4).- limits
Data limits
c(min, max), orNULLto train from the data.- breaks
Explicit legend breaks, or
NULL.- name
Legend title, or
NULLto derive from the encoding.
Value
The modified PlotSpec.
Details
A mapped linewidth gives each segment one constant width, taken as the
mean of its two endpoint values. So the width changes in visible steps at each
vertex rather than tapering smoothly along the line, and the round joins do
not perfectly fill the corners of a sharp bend. That is inherent to
per-segment width; a constant linewidth = is unaffected and still draws the
line as a single stroke.
No backend can stroke the segments of one path at different widths in a single
call, so a mapped linewidth emits one path element per segment in SVG and
PDF. On a long, dense line that is a lot of elements – worth knowing before
mapping linewidth on tens of thousands of rows.
For edges on a vgraph() plot, use scale_edge_width() instead: an edge's
width is trained and legended independently of the line-width scale. That also
means guides(linewidth = ) and lims(linewidth = ) address this scale;
use guides(edge_width = ) / lims(edge_width = ) for a graph's edges.
A missing (NA) width takes its segment's width from whichever endpoint is
known, so one missing value thins the line rather than erasing the two
segments that meet at it. A segment missing a width at both ends is dropped.