Add a secondary axis to a continuous position scale: a second set of ticks and
labels on the opposite edge (top for x, right for y), computed as a 1:1
monotonic transform of the primary axis. Pass the result to the sec.axis
argument of scale_x_continuous() / scale_y_continuous(). This is a
labelling convenience (unit conversions, count/proportion dual readouts,
duplicating an axis on a wide plot) — not an independent second axis with
its own data.
Usage
sec_axis(transform = ~., name = NULL, breaks = NULL, labels = NULL)

dup_axis(transform = ~., name = NULL, breaks = NULL, labels = NULL)
Arguments
- transform
The primary-to-secondary mapping: a formula using
.(e.g.~ . * 1.8 + 32), a function, or ascales::transform_log10()-style transform object. Must be monotonic over the axis range. Defaults to the identity,~ ..- name
Secondary axis title, or
NULLfor none.- breaks
Break positions in secondary units, or
NULLto compute them.- labels
A character vector of labels (one per break) or a labelling function, or
NULLfor the default number format.
Details
sec_axis() maps the primary axis through transform; dup_axis() is the
identity special case (a plain duplicate) with tidy defaults.
Limitations (current version)
Secondary axes are supported only on continuous position scales under the
default Cartesian coordinate system, with shared scales across facets.
Combining sec.axis with coord_flip() / coord_polar() / coord_trans(),
with free facet scales, or with add_marginal() raises an error. In a plot
composition (| / /) the secondary axis is not drawn.
Examples
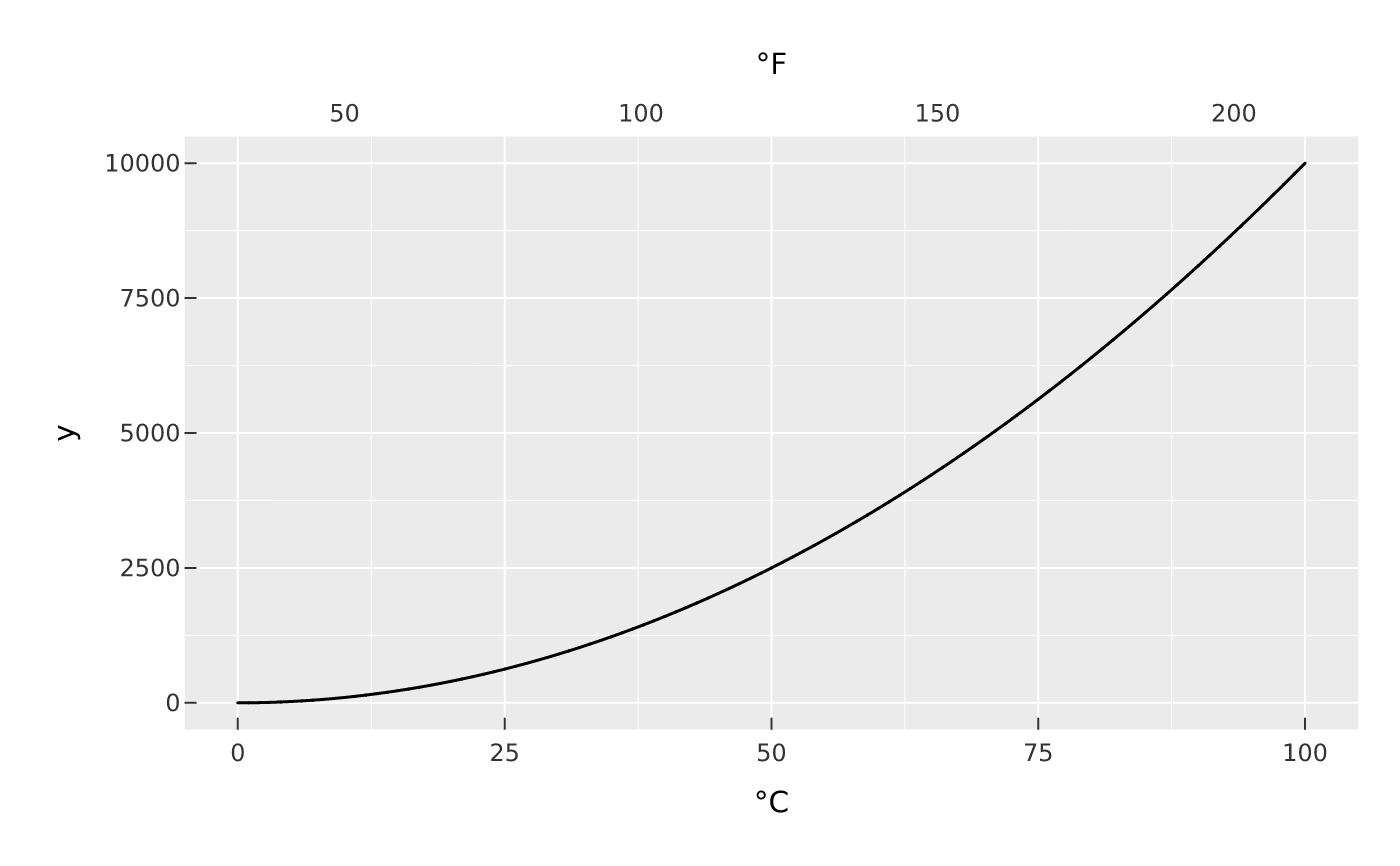
# Celsius with a Fahrenheit axis on top
vplot(data.frame(t = 0:100, y = (0:100)^2)) |>
mark_line(x = t, y = y) |>
scale_x_continuous(name = "°C", sec.axis = sec_axis(~ . * 1.8 + 32, name = "°F"))
 # Duplicate the y axis on the right
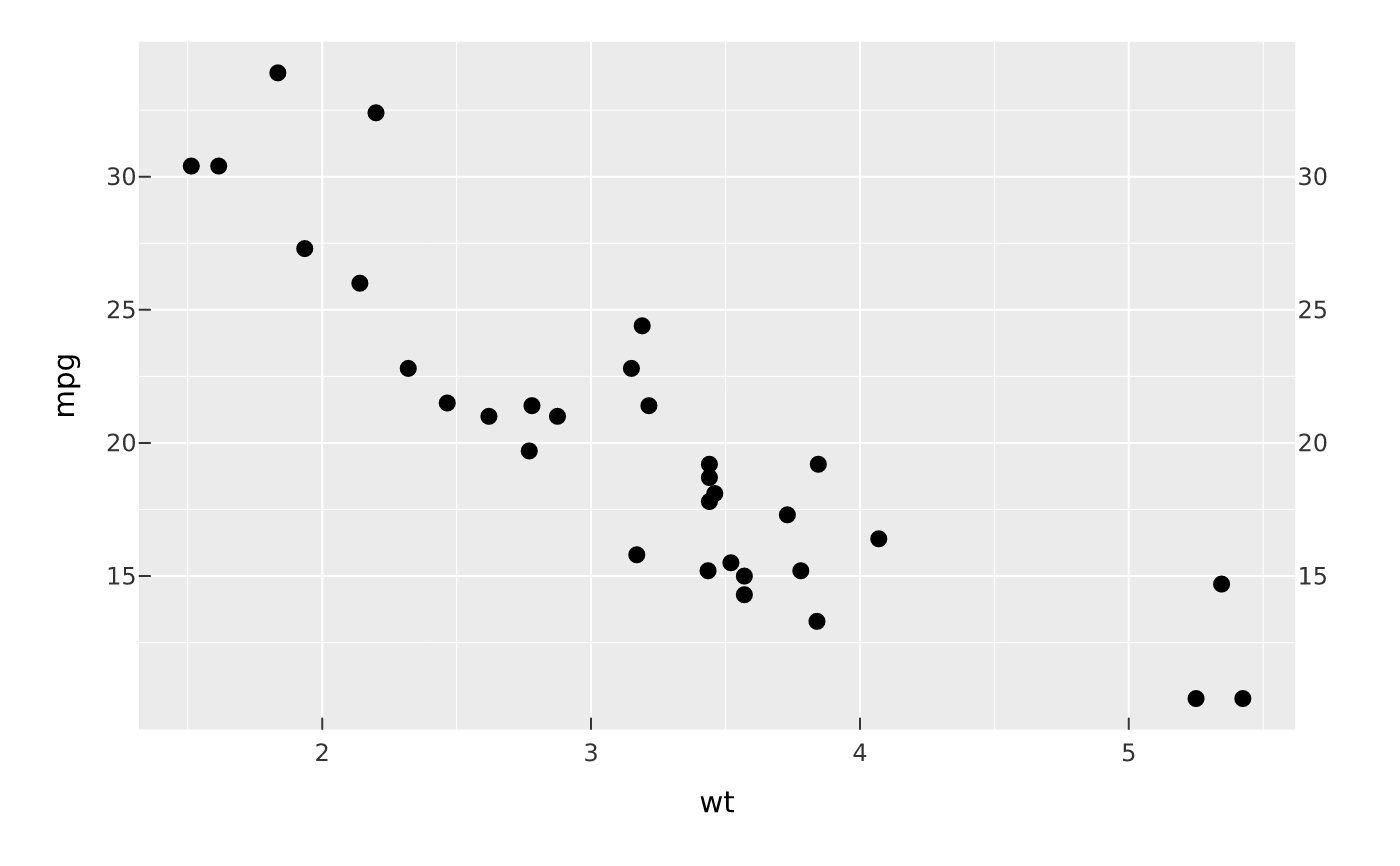
vplot(mtcars) |>
mark_point(x = wt, y = mpg) |>
scale_y_continuous(sec.axis = dup_axis())
# Duplicate the y axis on the right
vplot(mtcars) |>
mark_point(x = wt, y = mpg) |>
scale_y_continuous(sec.axis = dup_axis())