Declare a position scale to override the trained default. scale_x_continuous()
/ scale_y_continuous() handle numeric (and date/time) axes;
scale_x_discrete() / scale_y_discrete() handle categorical (band) axes and
let you set the level order via limits.
Usage
scale_x_continuous(
  plot,
  limits = NULL,
  trans = "identity",
  breaks = NULL,
  labels = NULL,
  name = NULL,
  expand = NULL,
  sec.axis = NULL
)

scale_y_continuous(
  plot,
  limits = NULL,
  trans = "identity",
  breaks = NULL,
  labels = NULL,
  name = NULL,
  expand = NULL,
  sec.axis = NULL
)

scale_x_discrete(plot, limits = NULL, name = NULL)

scale_y_discrete(plot, limits = NULL, name = NULL)
Arguments
- plot
A PlotSpec.
- limits
For continuous scales a numeric length-2 domain
c(min, max); for discrete scales a character vector of levels (sets order / subset).NULLtrains from the data.- trans
Transformation:
"identity"(default),"log10","sqrt","symlog"(symmetric log — linear through zero, logarithmic in the tails, so signed data and zero/negatives read on one axis),"reverse", or ascales::transform_log10()-style transform object.- breaks, labels
Explicit break positions (data units) and their labels, or
NULLto compute them.- name
Axis title, or
NULLto derive from the encoding.- expand
Axis padding beyond the data.
NULL(default) keeps the usual 5% breathing room; a numericc(mult, add)sets a proportion of the range plus a constant (either may be0), applied to both ends. Both act in the scale's transformed space, so on atrans = "log10"axisaddis in log units (matching how the axis is drawn). Useexpand = c(0, 0)to clamp the axis exactly to the data (e.g. a bar chart's baseline), orexpand = c(0.1, 0)for a wider margin.- sec.axis
A secondary axis from
sec_axis()/dup_axis(), drawn on the opposite edge, orNULLfor none. Continuous Cartesian plots only (seesec_axis()for the current limitations).
Value
The modified PlotSpec.
Examples
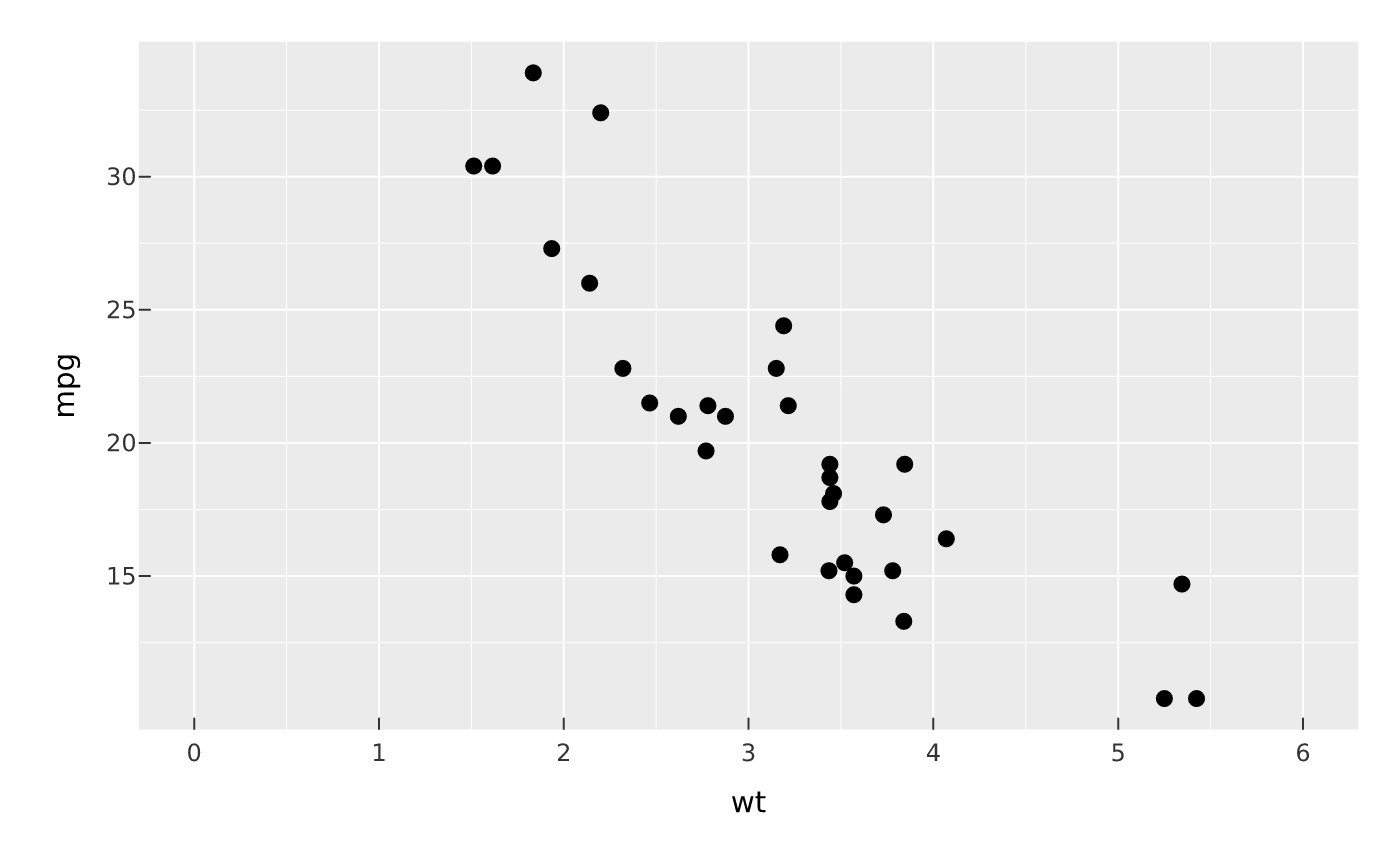
vplot(mtcars) |> mark_point(x = wt, y = mpg) |> scale_x_continuous(limits = c(0, 6))
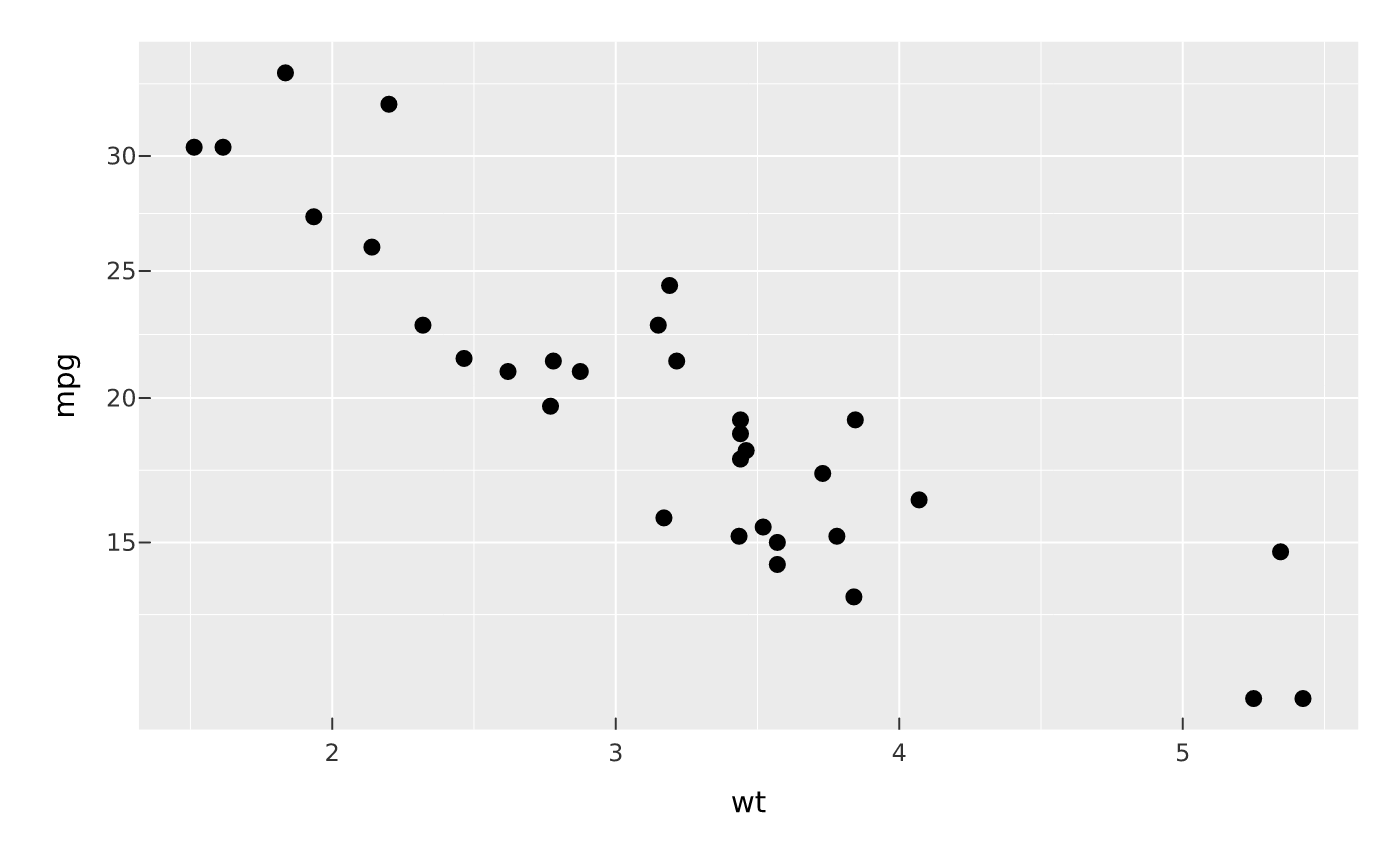
 vplot(mtcars) |> mark_point(x = wt, y = mpg) |> scale_y_continuous(trans = "sqrt")