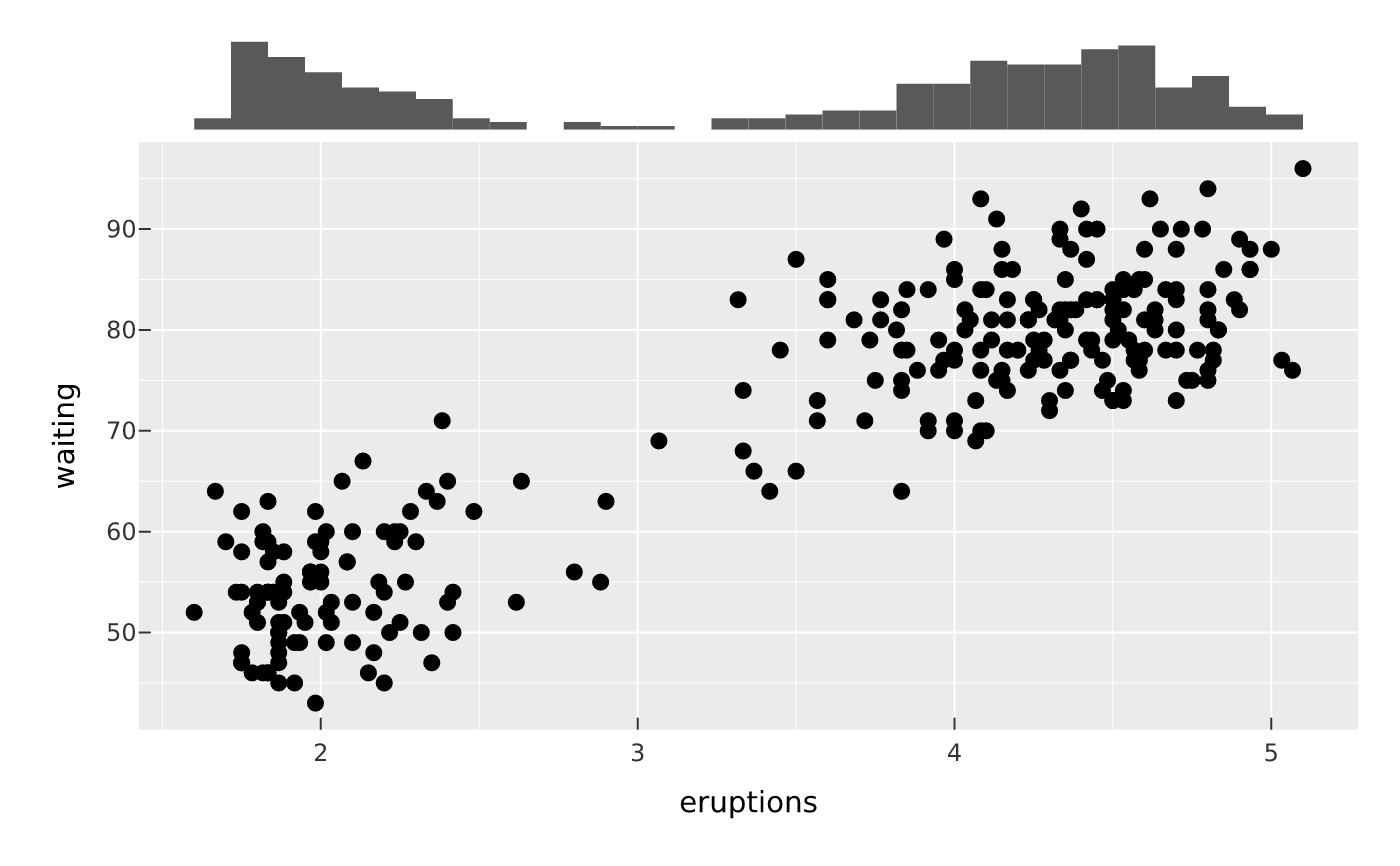
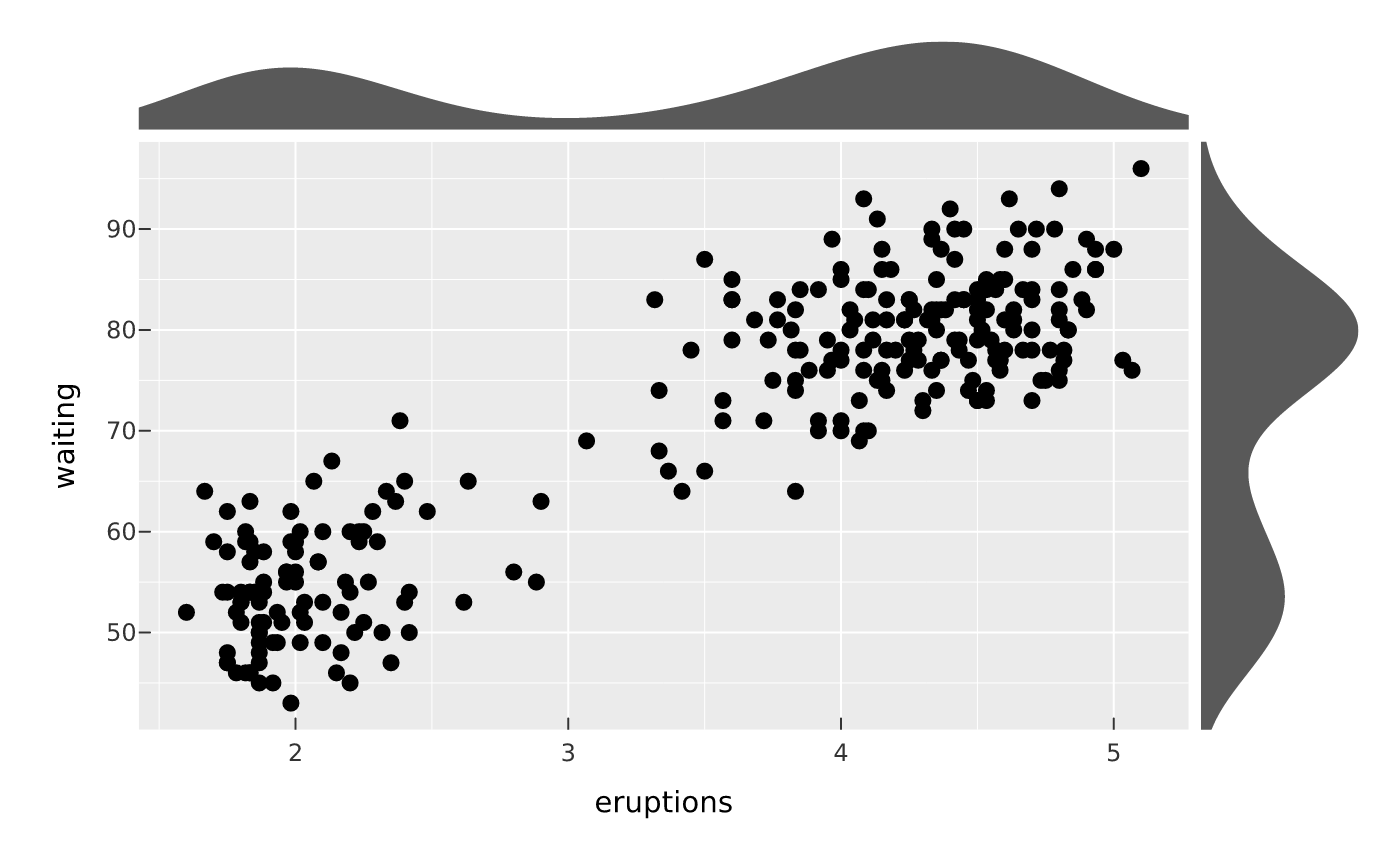
add_marginal() draws a distribution of the panel's x variable along the
top edge and/or of its y variable along the right edge, each sharing the
main panel's axis so it lines up with the scatter (the vellumplot analogue of
ggExtra::ggMarginal()). It is a plot-level modifier, like facet_wrap() or
coord_flip(): it takes no encoding of its own and instead reads x, y
(and, with group = TRUE, color) from the first layer that maps a numeric
x and y (typically your mark_point()).
Usage
add_marginal(
  plot,
  type = c("density", "histogram"),
  sides = "tr",
  size = 0.15,
  adjust = 1,
  bins = 30,
  group = FALSE
)
Arguments
- plot
- type
The marginal distribution:
"density"(a kernel-density curve, the default) or"histogram"(binned counts).- sides
Which edges to draw, as a string of
"t"(top, thexdistribution) and/or"r"(right, theydistribution). Default"tr".- size
The marginal size as a fraction of the panel, in
(0, 1).- adjust
Bandwidth multiplier for
type = "density"(seemark_density()).- bins
Number of bins for
type = "histogram"(seemark_histogram()).- group
When
TRUEand the plot mapscolor/fillto a discrete variable, draw one distribution per group in the matching colour (likeggMarginal(groupColour = TRUE)). The scatter's legend already covers them, so no extra legend is added.
Value
The modified PlotSpec.
Details
The marginals are drawn without their own axes or background. This version
supports a single panel only: combining it with facet_wrap() /
facet_grid(), a non-Cartesian coordinate system (coord_flip(),
coord_polar(), coord_fixed(), coord_sf()), or a locked aspect ratio is
an error.
Examples
vplot(faithful) |>
mark_point(x = eruptions, y = waiting) |>
add_marginal()
 vplot(faithful) |>
mark_point(x = eruptions, y = waiting) |>
add_marginal(type = "histogram", sides = "t")
vplot(faithful) |>
mark_point(x = eruptions, y = waiting) |>
add_marginal(type = "histogram", sides = "t")