Marks that apply a statistical transform before drawing. mark_histogram()
bins a continuous x and draws the per-bin counts as bars. mark_smooth()
fits a model of y on x (per group) and draws the fitted line, with a
confidence ribbon when se = TRUE.
Usage
mark_histogram(
  plot,
  ...,
  bins = 30,
  position = "stack",
  blend = NULL,
  sketch = NULL,
  data = NULL
)

mark_smooth(
  plot,
  ...,
  method = "auto",
  formula = NULL,
  span = 0.75,
  se = TRUE,
  level = 0.95,
  method.args = list(),
  blend = NULL,
  sketch = NULL,
  data = NULL
)
Arguments
- plot
- ...
Encodings (tidy-eval), e.g.
x,y,color/fill.- bins
Number of histogram bins.
- position
Position adjustment for the histogram bars (
"stack","dodge","fill").- blend
Optional blend mode for compositing this layer against what is already drawn beneath it (the panel and earlier layers), one of the CSS
mix-blend-modenames, e.g."multiply","screen","darken". The whole layer composites as one isolated group (not per element).- sketch
A
sketch()spec giving this layer a hand-drawn look (wobbly outlines, hachure fills),NA/FALSEto force it crisp (overriding a plot-widetheme_sketch()), orNULL(default) to inherit. Geometry marks accept it; text, raster, hex and datashade marks do not.- data
Optional layer data frame; overrides the plot data for this layer.
- method
Smoothing method: one of
"auto","lm","loess","glm","gam","rq".- formula
Model formula in terms of
xandy(e.g.y ~ poly(x, 2),y ~ s(x)forgam). Defaults toy ~ x(y ~ s(x)forgam).- span
loessneighbourhood size (larger = smoother).- se
Draw a confidence ribbon around the smooth? Ignored for
"rq".- level
Confidence level for the ribbon.
- method.args
Extra arguments to the fitting function, e.g.
list(family = binomial())forglm, orlist(tau = 0.9)forrq.
Value
The modified PlotSpec.
Details
mark_smooth() supports several methods:
"auto"(default) picks"loess"for small groups (< 1000 points) and"gam"for large ones."lm"/"glm"— linear and generalised linear fits (glmtakes afamilyviamethod.args, e.g.binomial()for logistic)."loess"— local regression, controlled byspan."gam"— a generalised additive model with a smooth term (defaulty ~ s(x)); needs the mgcv package."rq"— quantile regression at a singlemethod.args$tau(default the median); needs the quantreg package and draws the fitted line only (no confidence ribbon). For several quantiles, add one layer pertau.
Examples
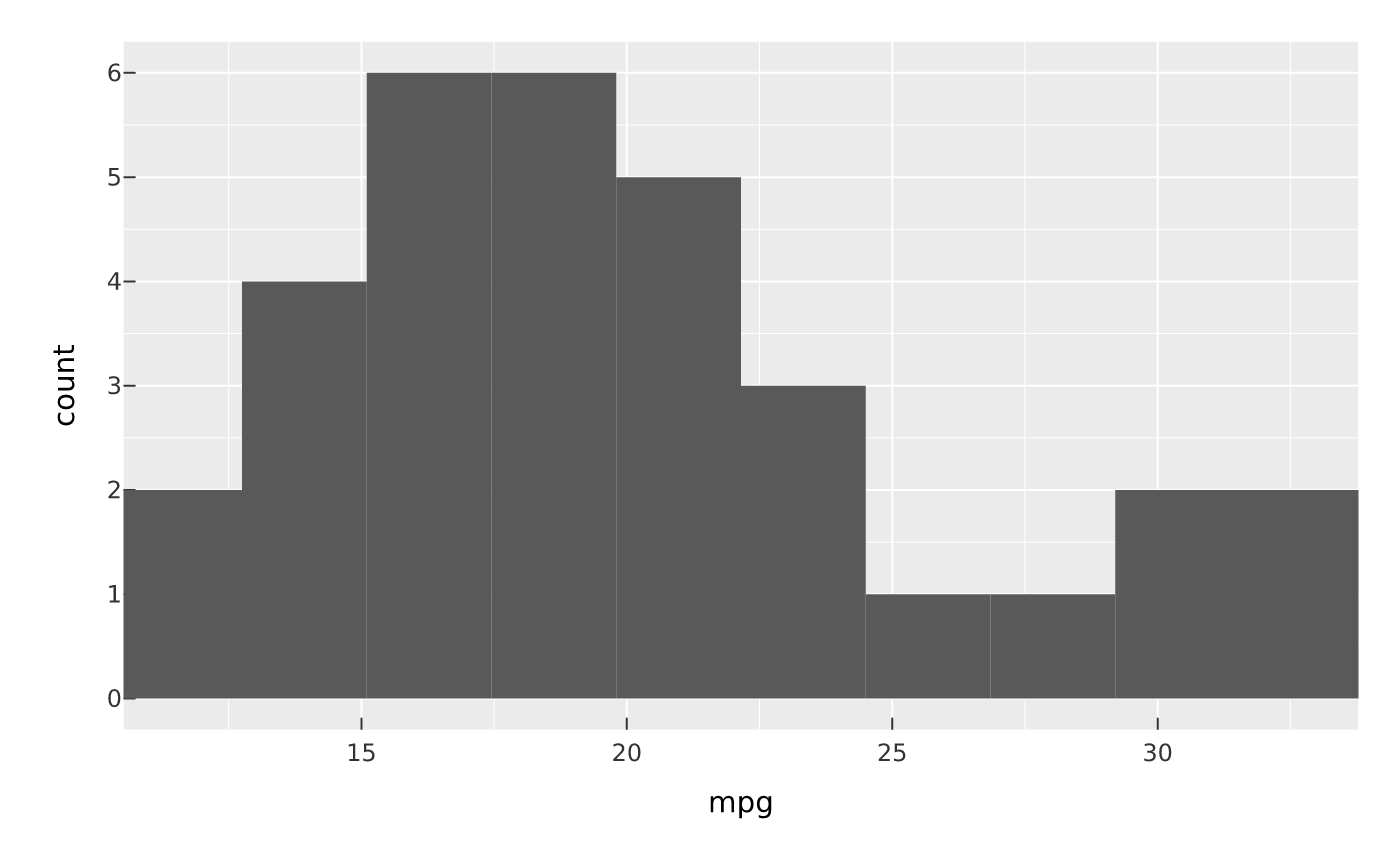
vplot(mtcars) |> mark_histogram(x = mpg, bins = 10)
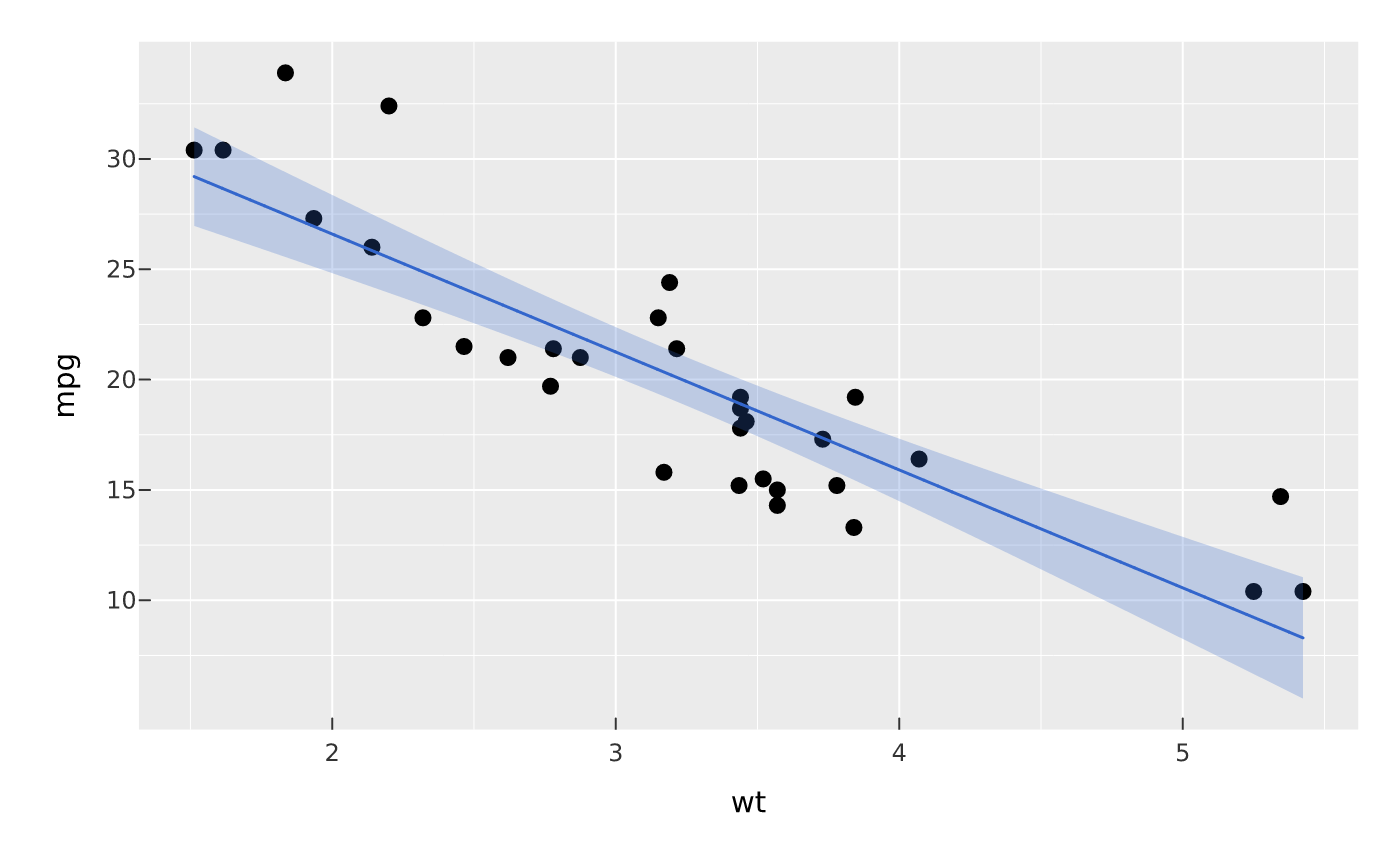
 vplot(mtcars) |> mark_point(x = wt, y = mpg) |> mark_smooth(x = wt, y = mpg)
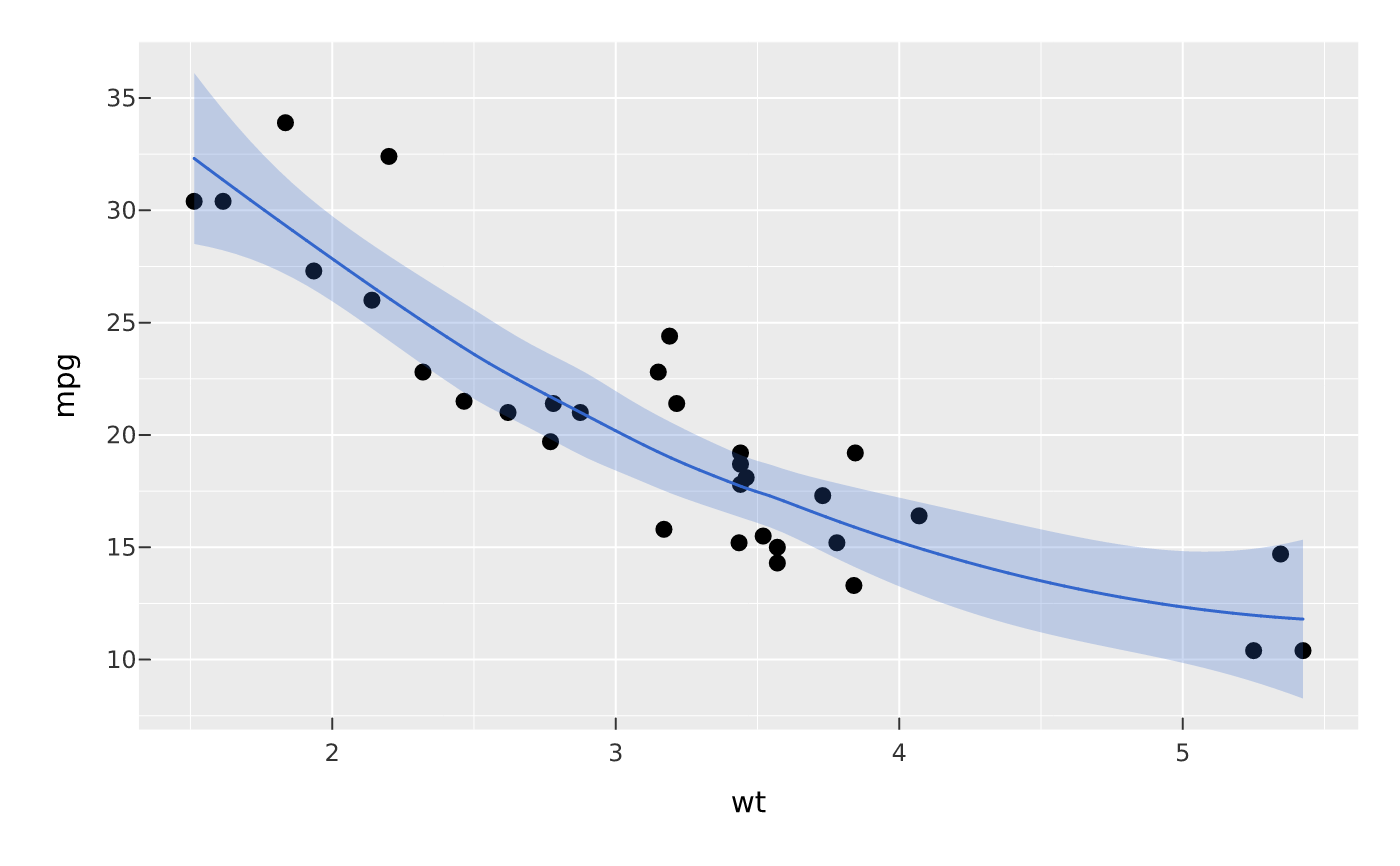
 # local regression with a wider neighbourhood
vplot(mtcars) |>
mark_point(x = wt, y = mpg) |>
mark_smooth(x = wt, y = mpg, method = "loess", span = 0.9)
# local regression with a wider neighbourhood
vplot(mtcars) |>
mark_point(x = wt, y = mpg) |>
mark_smooth(x = wt, y = mpg, method = "loess", span = 0.9)