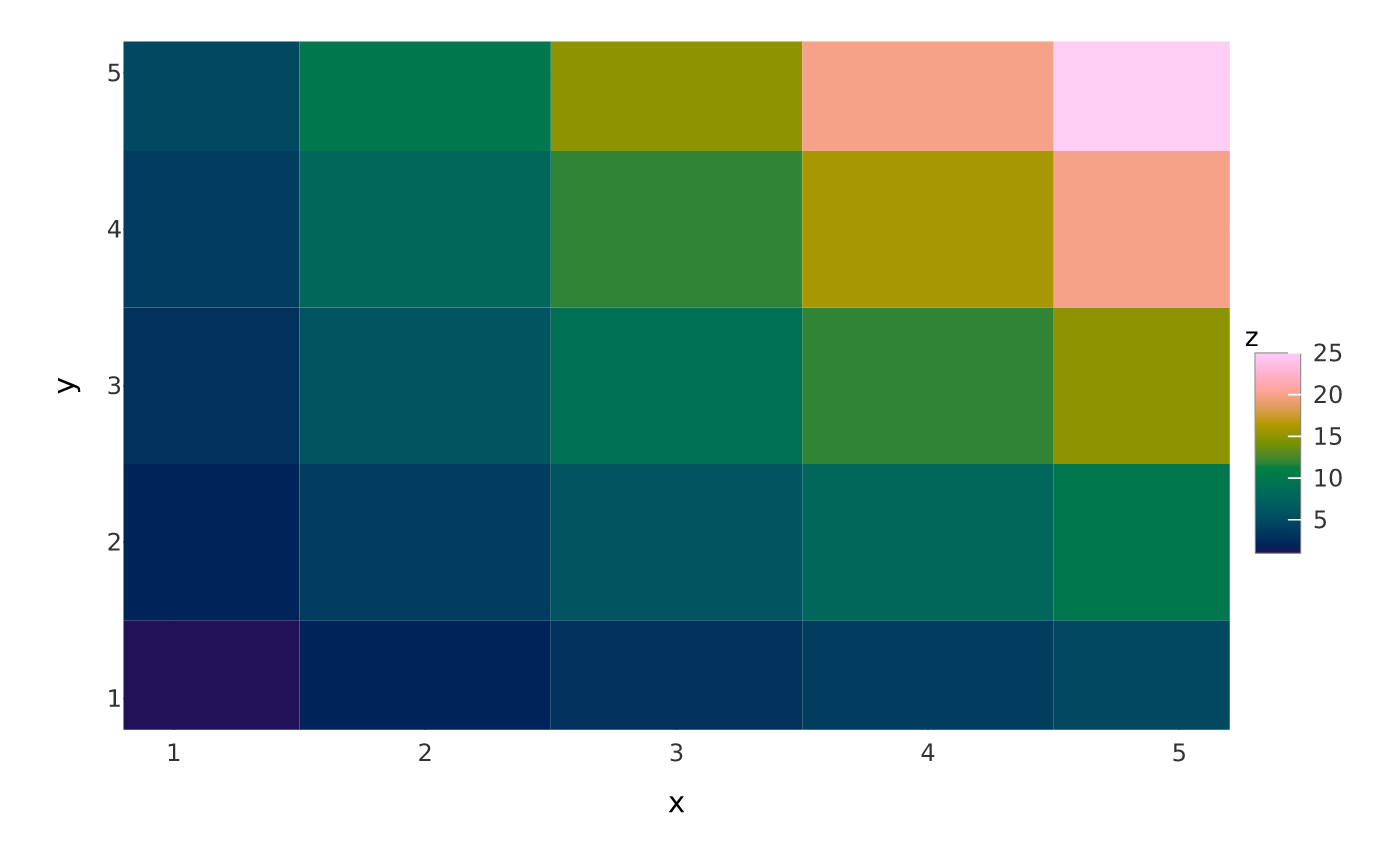
mark_tile() draws a rectangular tile at each (x, y) coloured by fill;
mark_raster() draws the same as one raster image (a fast path requiring a
complete regular grid). mark_bin2d() bins continuous x/y into a grid and
colours each cell by count. mark_density() draws a 1-D kernel density of x
as a filled curve.
Usage
mark_tile(plot, ..., blend = NULL, sketch = NULL, data = NULL)

mark_raster(plot, ..., blend = NULL, data = NULL)

mark_bin2d(plot, ..., bins = 30, blend = NULL, data = NULL)

mark_density(plot, ..., adjust = 1, blend = NULL, sketch = NULL, data = NULL)

mark_hex(plot, ..., bins = 30, blend = NULL, data = NULL)
Arguments
- plot
- ...
Encodings (tidy-eval):
x,y,fillfor tile/raster;x,yfor bin2d;x(+fill/color) for density.- blend
Optional blend mode for compositing this layer against what is already drawn beneath it (the panel and earlier layers), one of the CSS
mix-blend-modenames, e.g."multiply","screen","darken". The whole layer composites as one isolated group (not per element).- sketch
A
sketch()spec giving this layer a hand-drawn look (wobbly outlines, hachure fills),NA/FALSEto force it crisp (overriding a plot-widetheme_sketch()), orNULL(default) to inherit. Geometry marks accept it; text, raster, hex and datashade marks do not.- data
Optional layer data frame; overrides the plot data for this layer.
- bins
Number of bins per axis for
mark_bin2d()/ hex columns formark_hex().- adjust
Bandwidth multiplier for
mark_density().
Value
The modified PlotSpec.
Examples
d <- expand.grid(x = 1:5, y = 1:5)
d$z <- d$x * d$y
vplot(d) |> mark_tile(x = x, y = y, fill = z)