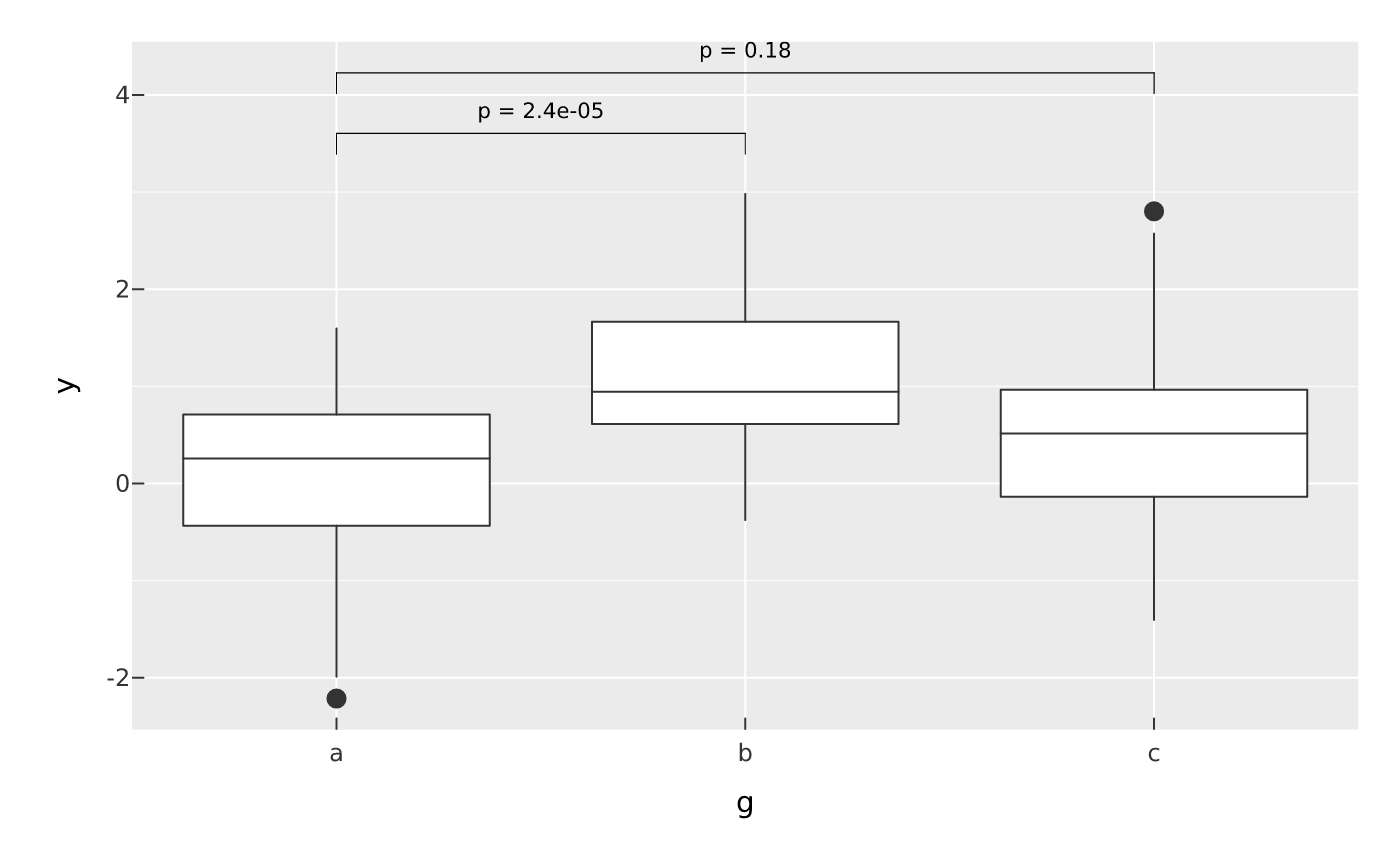
mark_signif() runs a pairwise test between x groups and draws a
significance bracket over each comparison with its p-value (or stars) —
the ggsignif / ggpubr idiom. Add it on top of a mark_boxplot() /
mark_violin(); the brackets stack above the data and the y-axis expands to
fit them.
Arguments
- plot
- ...
Encodings (tidy-eval): a categorical
xand the numericy.- comparisons
A list of length-2 character vectors naming the group pairs to test, e.g.
list(c("a", "b"), c("b", "c")).NULL(default) tests each adjacent pair of levels.- method
The two-sample test:
"wilcox.test"(default) or"t.test".- label
"p"(default, a formatted p-value) or"stars"(*/**/***/****/ns).- step
Vertical gap between stacked brackets, as a fraction of the data's y range (default
0.12).- tip_length
Bracket down-tick length, as a fraction of the y range (default
0.03).- blend
Optional blend mode for compositing this layer against what is already drawn beneath it (the panel and earlier layers), one of the CSS
mix-blend-modenames, e.g."multiply","screen","darken". The whole layer composites as one isolated group (not per element).- sketch
A
sketch()spec giving this layer a hand-drawn look (wobbly outlines, hachure fills),NA/FALSEto force it crisp (overriding a plot-widetheme_sketch()), orNULL(default) to inherit. Geometry marks accept it; text, raster, hex and datashade marks do not.- data
Optional layer data frame; overrides the plot data for this layer.
Value
The modified PlotSpec.