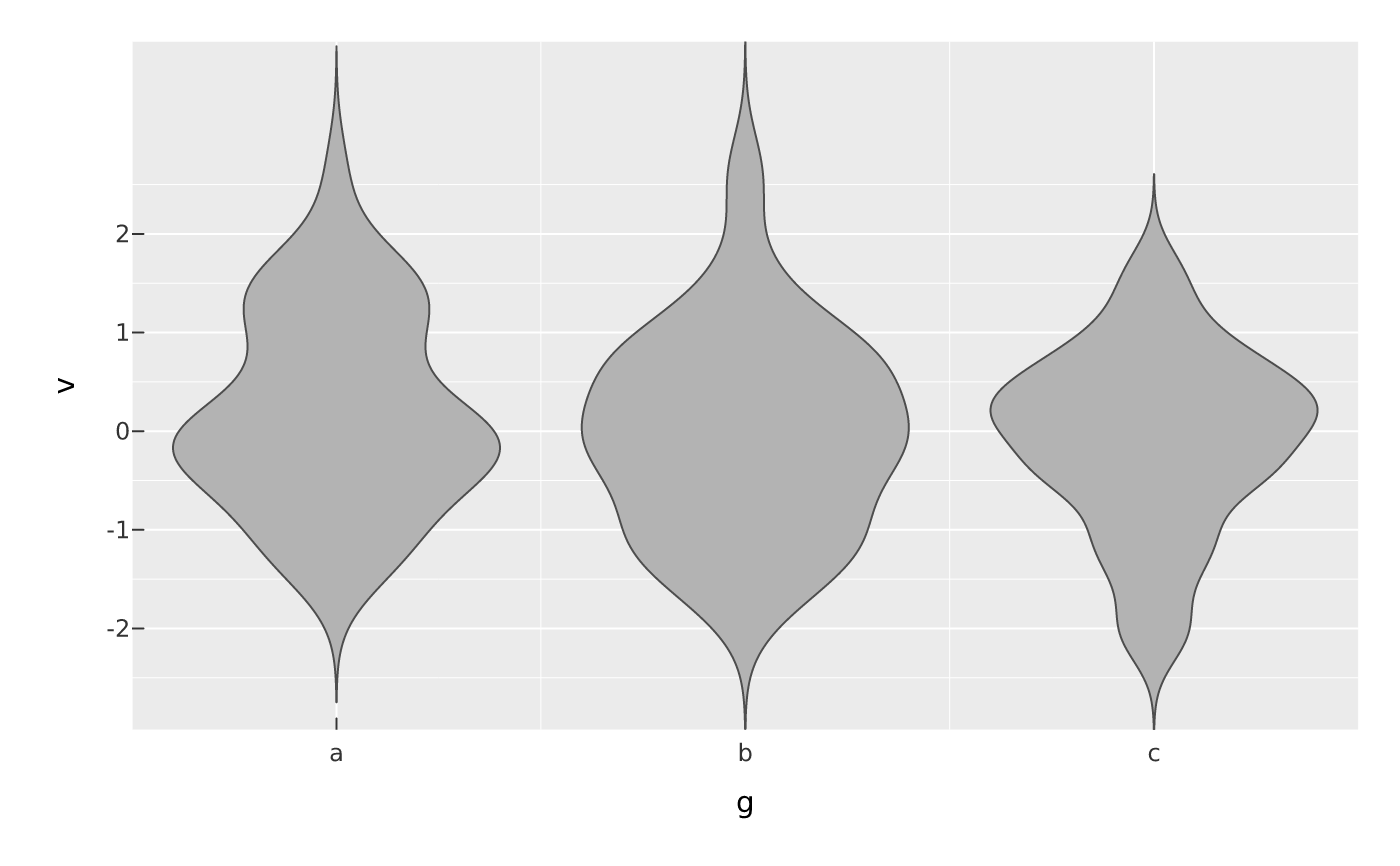
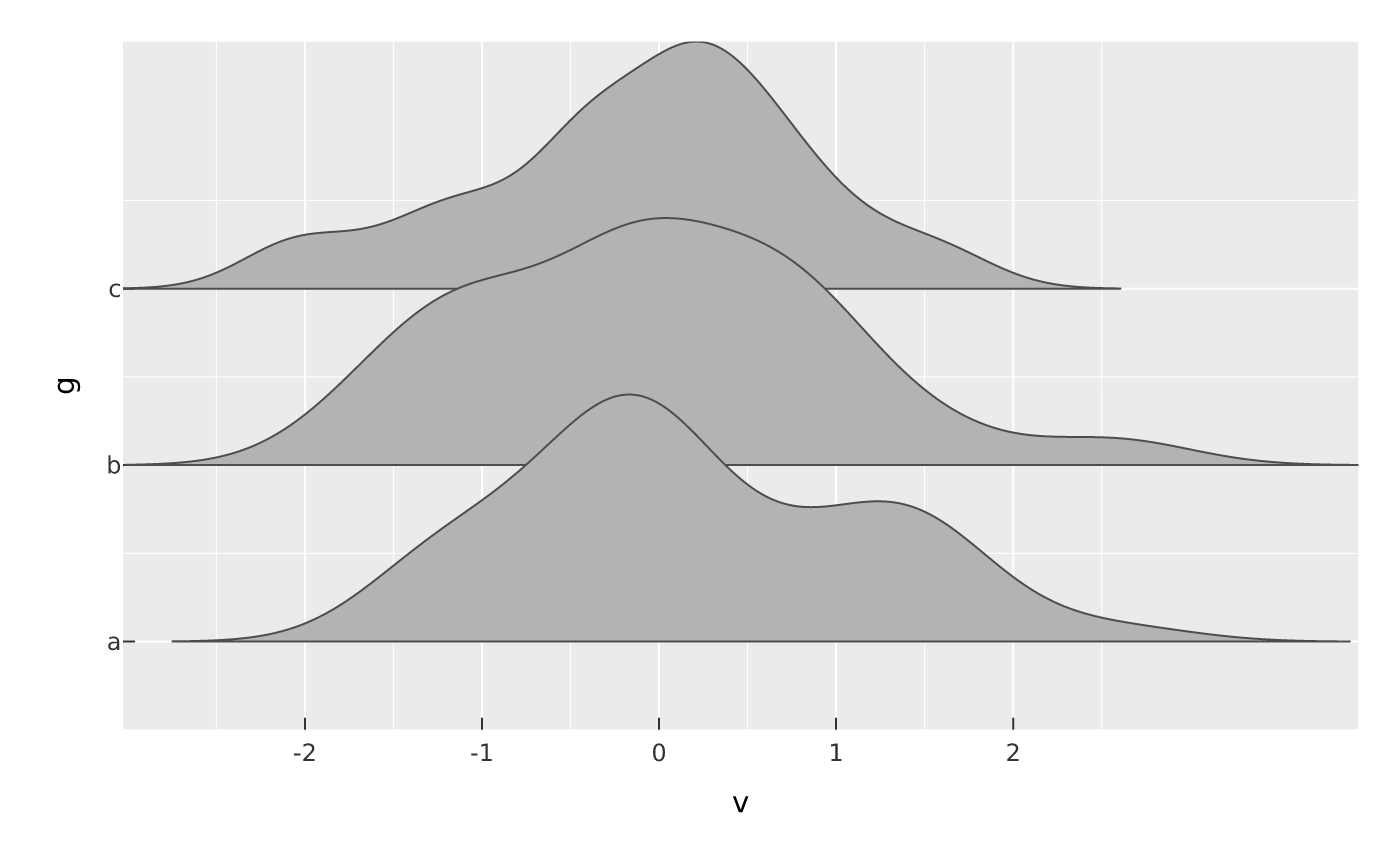
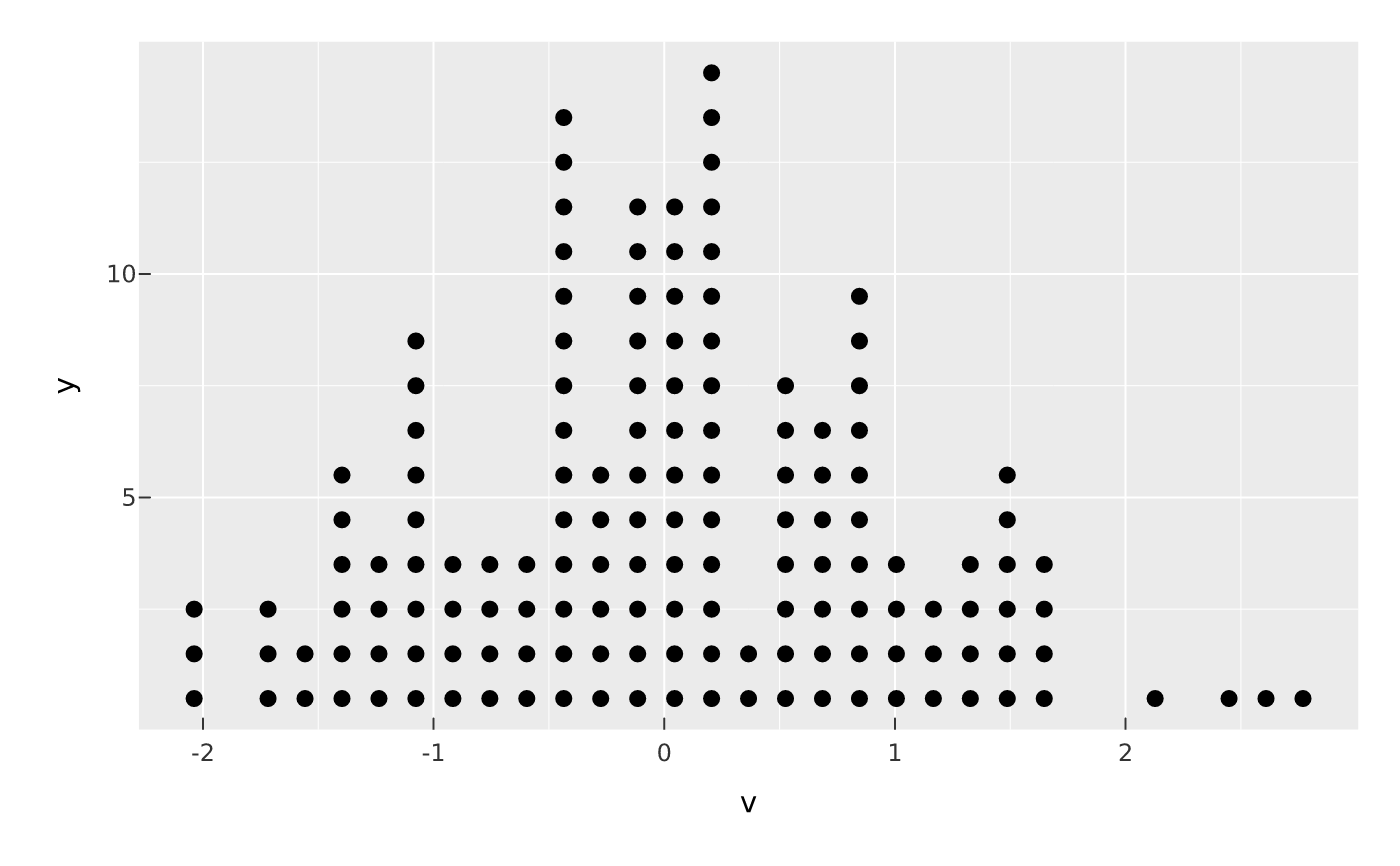
Marks that draw a variable's distribution as a filled shape.
mark_violin() draws a mirrored kernel density of y per categorical x
(like a boxplot's footprint); mark_ridgeline() draws a kernel density of x
per categorical y as overlapping ridges. mark_dotplot() bins x and
stacks one dot per observation.
Usage
mark_violin(plot, ..., adjust = 1, blend = NULL, sketch = NULL, data = NULL)

mark_ridgeline(
  plot,
  ...,
  adjust = 1,
  height = 1.4,
  blend = NULL,
  sketch = NULL,
  data = NULL
)

mark_dotplot(
  plot,
  ...,
  binwidth = NULL,
  blend = NULL,
  sketch = NULL,
  data = NULL
)
Arguments
- plot
A PlotSpec.
- ...
Encodings.
mark_violin()needs categoricalxand numericy;mark_ridgeline()needs numericxand categoricaly;mark_dotplot()needsx. A mappedcolor/fillsets the shape fill.- adjust
Kernel-density bandwidth multiplier (violin/ridgeline).
- blend, sketch, data
Standard layer arguments (see
mark_point()).- height
Ridge height as a multiple of the row band (ridgeline; default
1.4, so adjacent ridges overlap slightly).- binwidth
Dot-plot bin width, or
NULLto use ~1/30 of the data range.
Value
The modified PlotSpec.