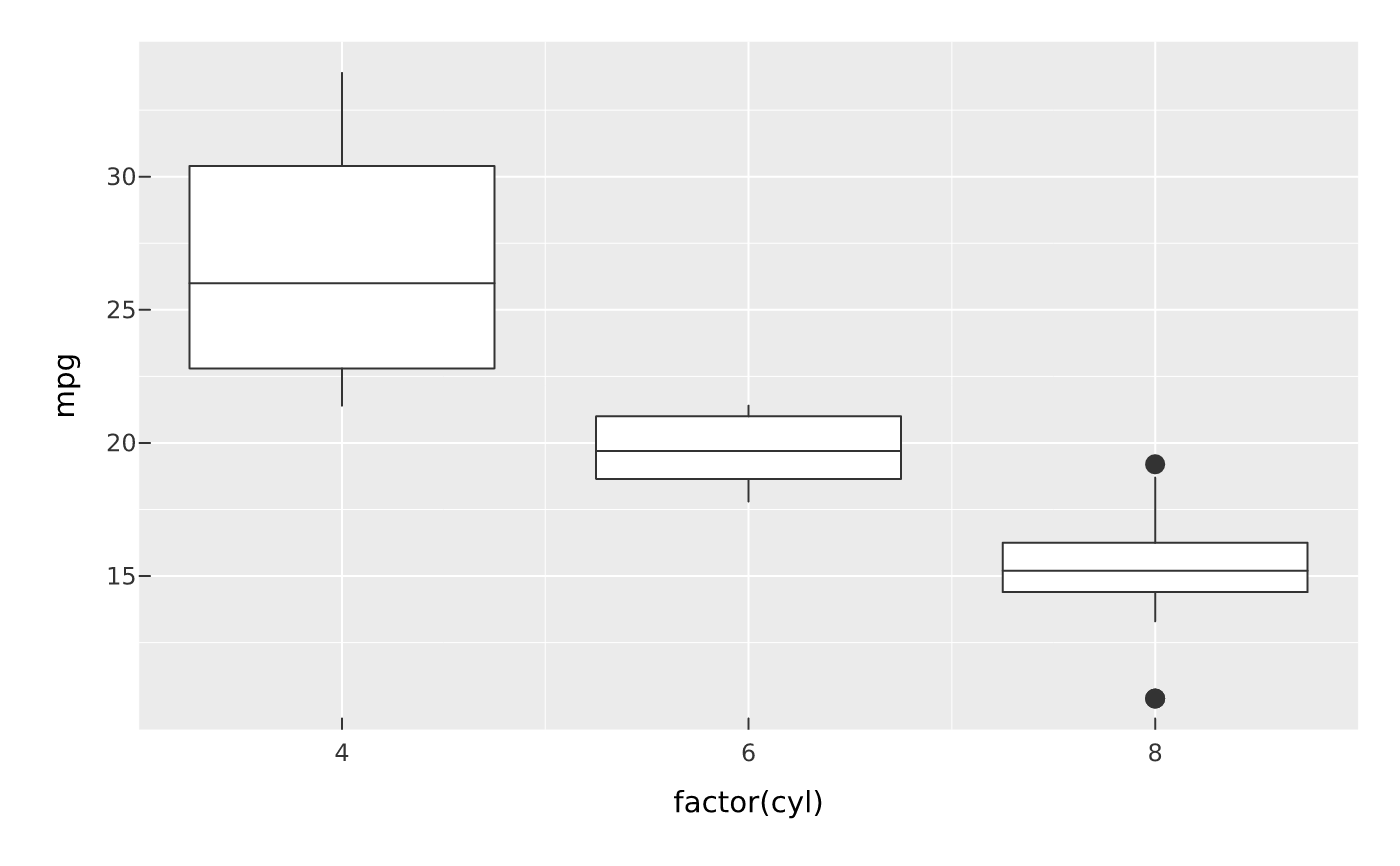
mark_boxplot() draws a box-and-whisker per x category from the raw y
values (box = Q1-Q3, median line, 1.5*IQR whiskers, outlier points).
mark_errorbar() draws vertical bars from ymin to ymax with horizontal
caps; mark_linerange() omits the caps. mark_summary() aggregates y per
x with fun (default mean) and draws the result as points.
Usage
mark_boxplot(plot, ..., blend = NULL, sketch = NULL, data = NULL)

mark_errorbar(plot, ..., width = 0.5, blend = NULL, sketch = NULL, data = NULL)

mark_linerange(plot, ..., blend = NULL, sketch = NULL, data = NULL)

mark_summary(plot, ..., fun = mean, blend = NULL, sketch = NULL, data = NULL)

mark_pointrange(plot, ..., blend = NULL, sketch = NULL, data = NULL)

mark_crossbar(plot, ..., width = 0.5, blend = NULL, sketch = NULL, data = NULL)
Arguments
- plot
- ...
Encodings (tidy-eval):
x,yfor boxplot/summary;x,ymin,ymaxfor errorbar/linerange; pluscolor/fill(andlinetypefor errorbar/linerange).- blend
Optional blend mode for compositing this layer against what is already drawn beneath it (the panel and earlier layers), one of the CSS
mix-blend-modenames, e.g."multiply","screen","darken". The whole layer composites as one isolated group (not per element).- sketch
A
sketch()spec giving this layer a hand-drawn look (wobbly outlines, hachure fills),NA/FALSEto force it crisp (overriding a plot-widetheme_sketch()), orNULL(default) to inherit. Geometry marks accept it; text, raster, hex and datashade marks do not.- data
Optional layer data frame; overrides the plot data for this layer.
- width
For
mark_errorbar(), the cap width as a fraction of the band.- fun
For
mark_summary(), the aggregation function (defaultmean).
Value
The modified PlotSpec.
Details
mark_pointrange() draws a point at (x, y) with a vertical line from ymin
to ymax (an identity mark — supply the summary values yourself, e.g. from a
model). mark_crossbar() draws a box spanning ymin..ymax with a
horizontal line at y. Both are the identity counterparts of the aggregating
mark_interval().