Marks for visualising a distribution's shape and its summary intervals
together, in the style of the ggdist package — a natural fit for
posterior draws or bootstrap samples (one row per draw, grouped by a
categorical x).
Arguments
- plot
- ...
Encodings (tidy-eval): a categorical
xand the sampley(+color/fill).- .width
Interval probabilities, widest last (default
c(0.66, 0.95)).- point
Central summary:
"median"(default) or"mean".- adjust
mark_halfeye()density bandwidth multiplier.- scale
Slab width as a fraction of the category band (
mark_halfeye()).- blend
Optional blend mode for compositing this layer against what is already drawn beneath it (the panel and earlier layers), one of the CSS
mix-blend-modenames, e.g."multiply","screen","darken". The whole layer composites as one isolated group (not per element).- sketch
A
sketch()spec giving this layer a hand-drawn look (wobbly outlines, hachure fills),NA/FALSEto force it crisp (overriding a plot-widetheme_sketch()), orNULL(default) to inherit. Geometry marks accept it; text, raster, hex and datashade marks do not.- data
Optional layer data frame; overrides the plot data for this layer.
Value
The modified PlotSpec.
Details
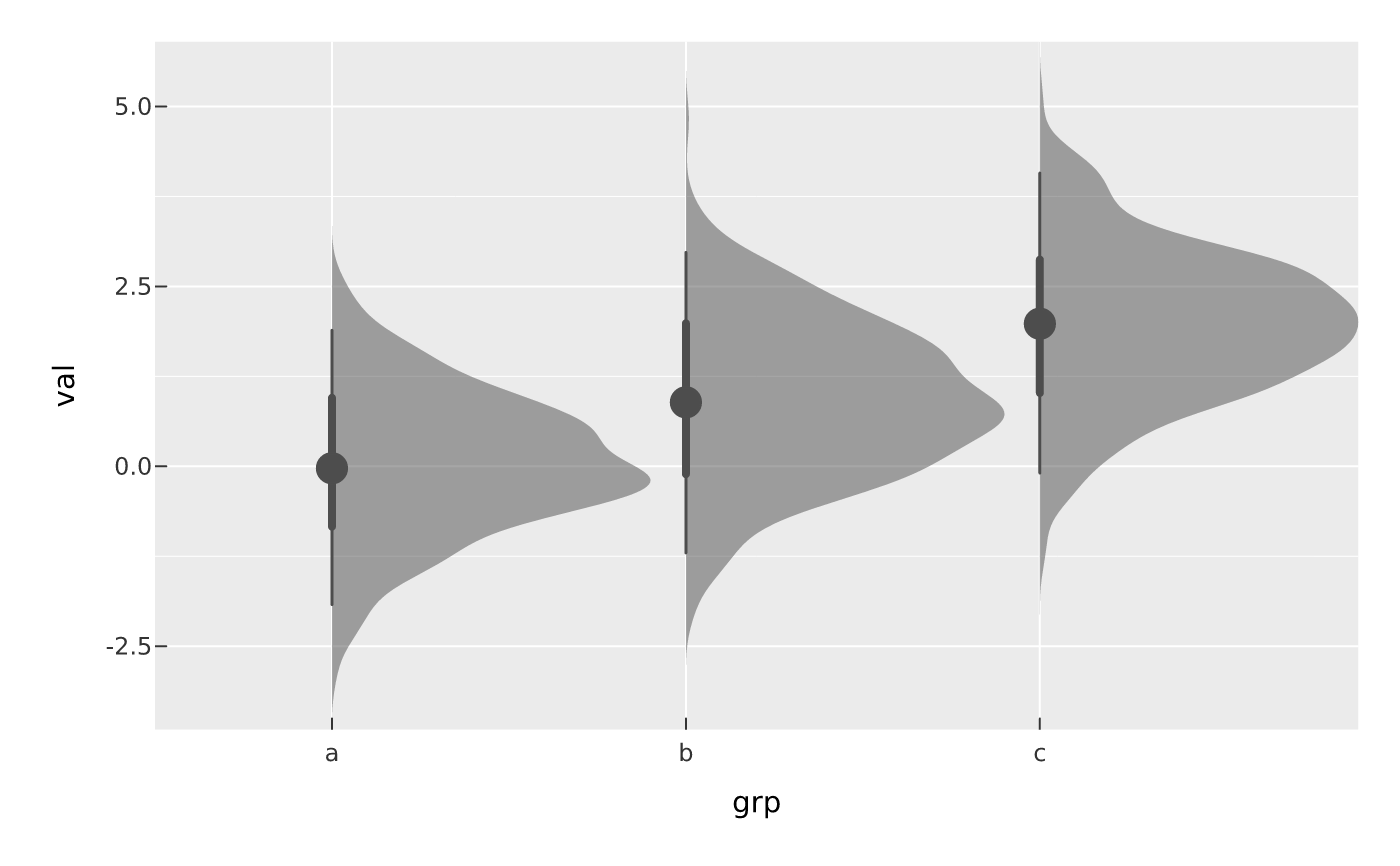
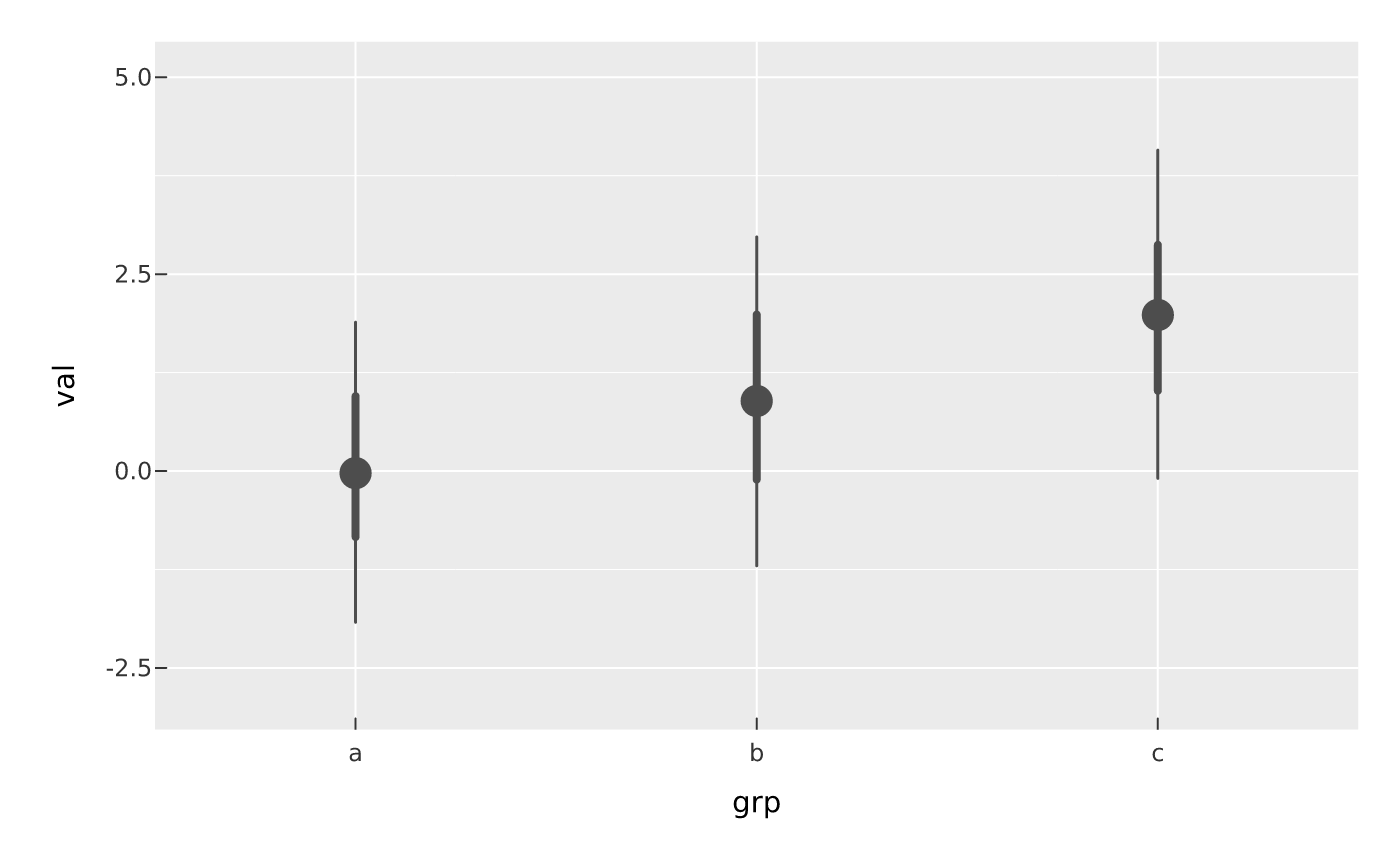
mark_halfeye()draws, perxcategory, a one-sided density "slab" (a half violin) with a point-interval at its base: the median (or mean) as a point, a thick bar for the inner interval and a thin bar for the outer one.mark_interval()draws the point-interval alone (no slab).
Intervals are equal-tailed quantile intervals at the .width probabilities
(widest drawn thinnest). Supply many draws per x (e.g. posterior samples).