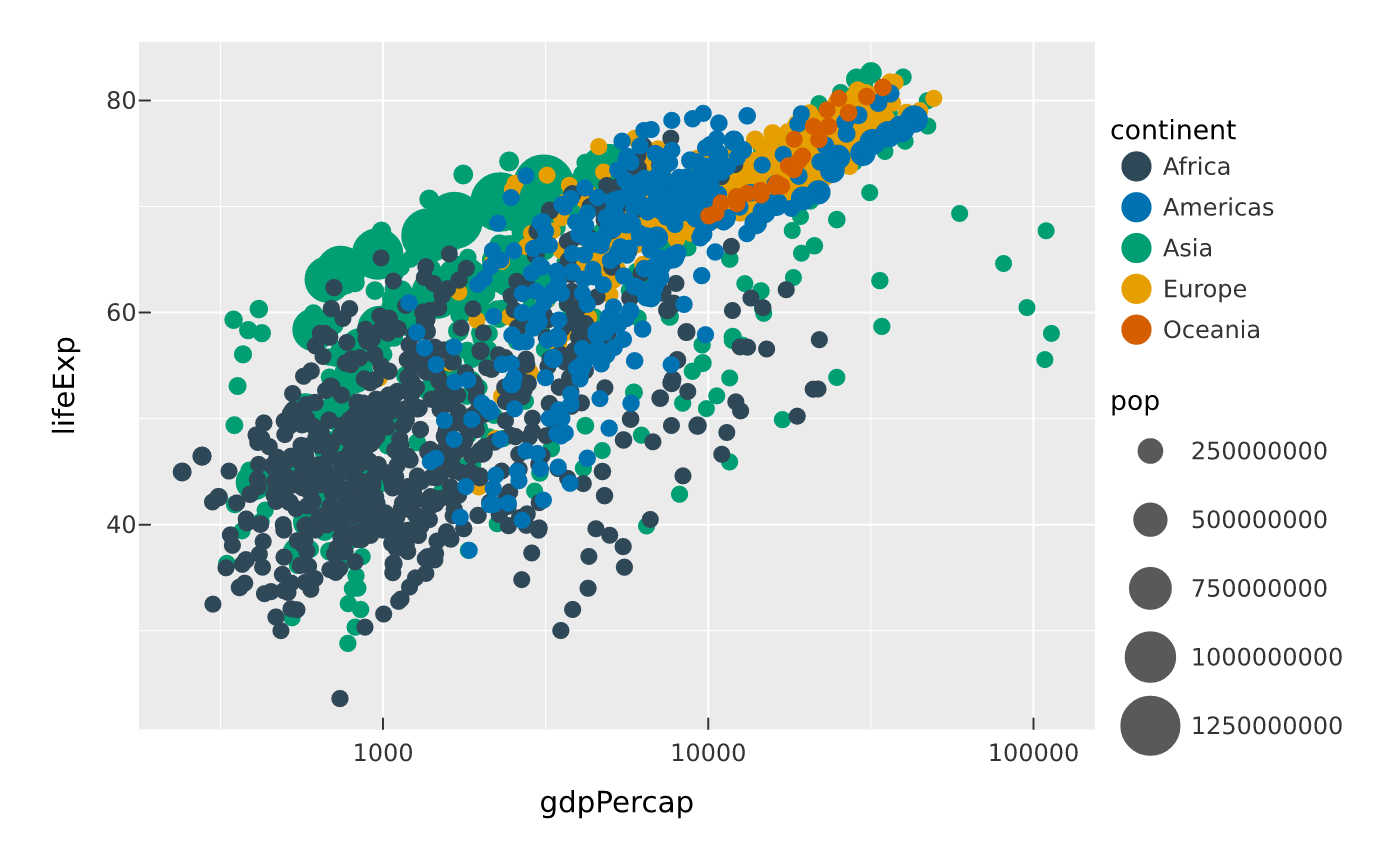
transition_time() is like transition_states() but treats time as a
continuous quantity: the states are its distinct values and each transition is
allocated frames in proportion to its time gap, so the animation plays at a
constant rate through unevenly spaced times. There is no pause on a state and no
wrap — time flows once, start to finish.
Value
The modified PlotSpec.
Examples
if (requireNamespace("gapminder", quietly = TRUE)) {
  vplot(gapminder::gapminder) |>
    mark_point(x = gdpPercap, y = lifeExp, size = pop, color = continent) |>
    scale_x_continuous(trans = "log10") |>
    transition_time(year)
}