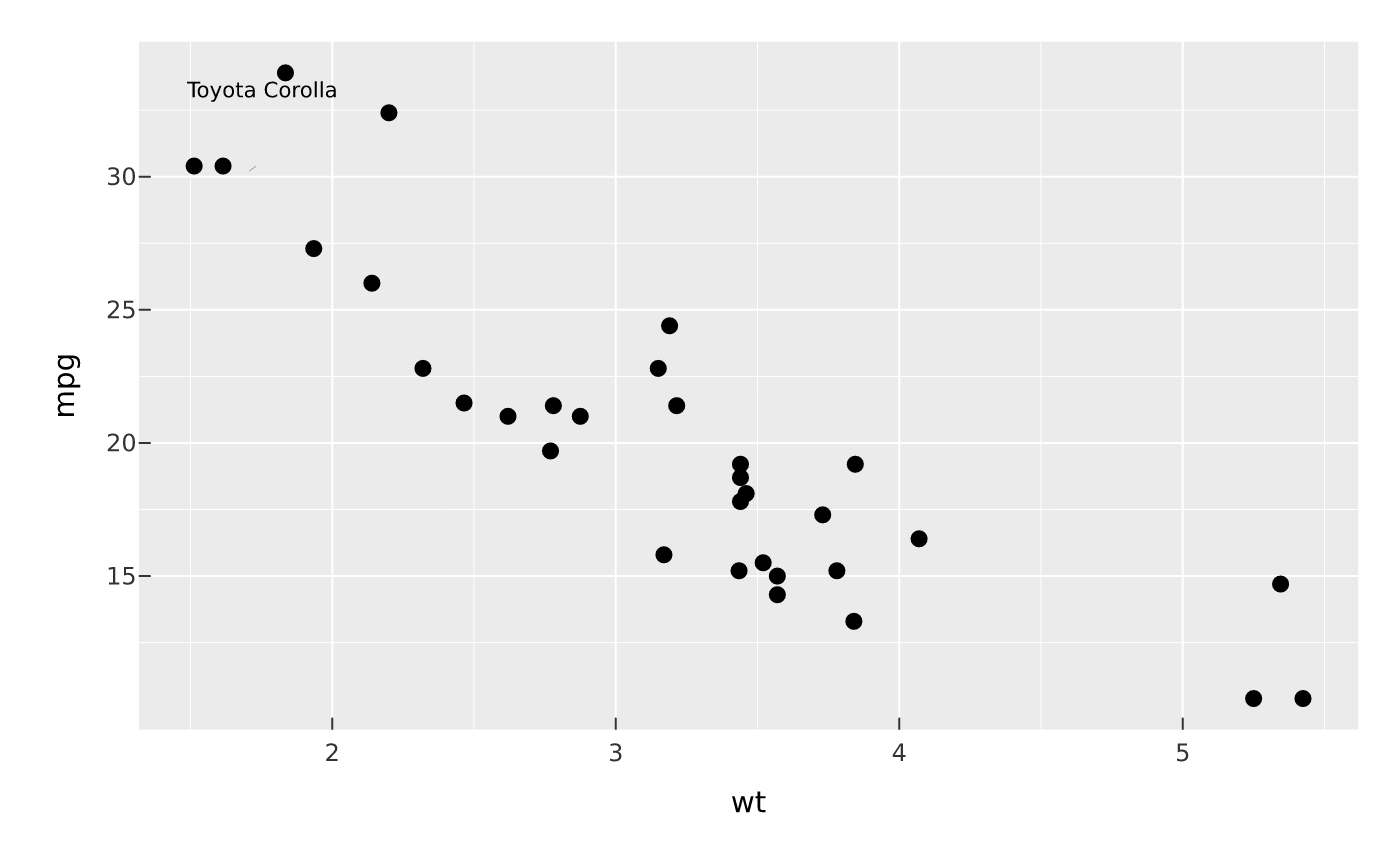
mark_outlier_label() labels only the outlying points — the extremes,
where the story usually is — instead of every datum. It keeps the rows whose
y is an outlier (per colour/fill group) and labels just those, repelled
apart with the same solver as mark_text(). Layer it over the raw points.
Usage
mark_outlier_label(
  plot,
  ...,
  method = c("iqr", "sd"),
  k = 1.5,
  size = NULL,
  repel = TRUE,
  box_padding = 1,
  min_segment_length = 2,
  blend = NULL,
  data = NULL
)
Arguments
- plot
- ...
Encodings (tidy-eval):
x,y, an optionallabel(what to write on each outlier), and optionallycolor/fillto detect outliers within each group.- method
Outlier rule:
"iqr"(Tukey's, the default) or"sd".- k
Threshold multiplier — IQR whisker length (default
1.5) or number of standard deviations.- size
Font size in points.
- repel
Move overlapping labels apart (force-directed, ggrepel-style), with leader lines to the points? Single cartesian panel only.
- box_padding
Extra space (mm) kept around each label box during repulsion.
- min_segment_length
Shortest leader line (mm) worth drawing; a label that barely moved gets none.
- blend
Optional blend mode for compositing this layer against what is already drawn beneath it (the panel and earlier layers), one of the CSS
mix-blend-modenames, e.g."multiply","screen","darken". The whole layer composites as one isolated group (not per element).- data
Optional layer data frame; overrides the plot data for this layer.
Value
The modified PlotSpec.
Details
The default method = "iqr" flags y outside [Q1 - k*IQR, Q3 + k*IQR] (the
boxplot whisker rule); method = "sd" flags |y - mean| > k * sd. Map a
label to name each outlier; with none mapped, the outlier's y value is the
label.
Examples
vplot(mtcars) |>
  mark_point(x = wt, y = mpg) |>
  mark_outlier_label(x = wt, y = mpg, label = rownames(mtcars))