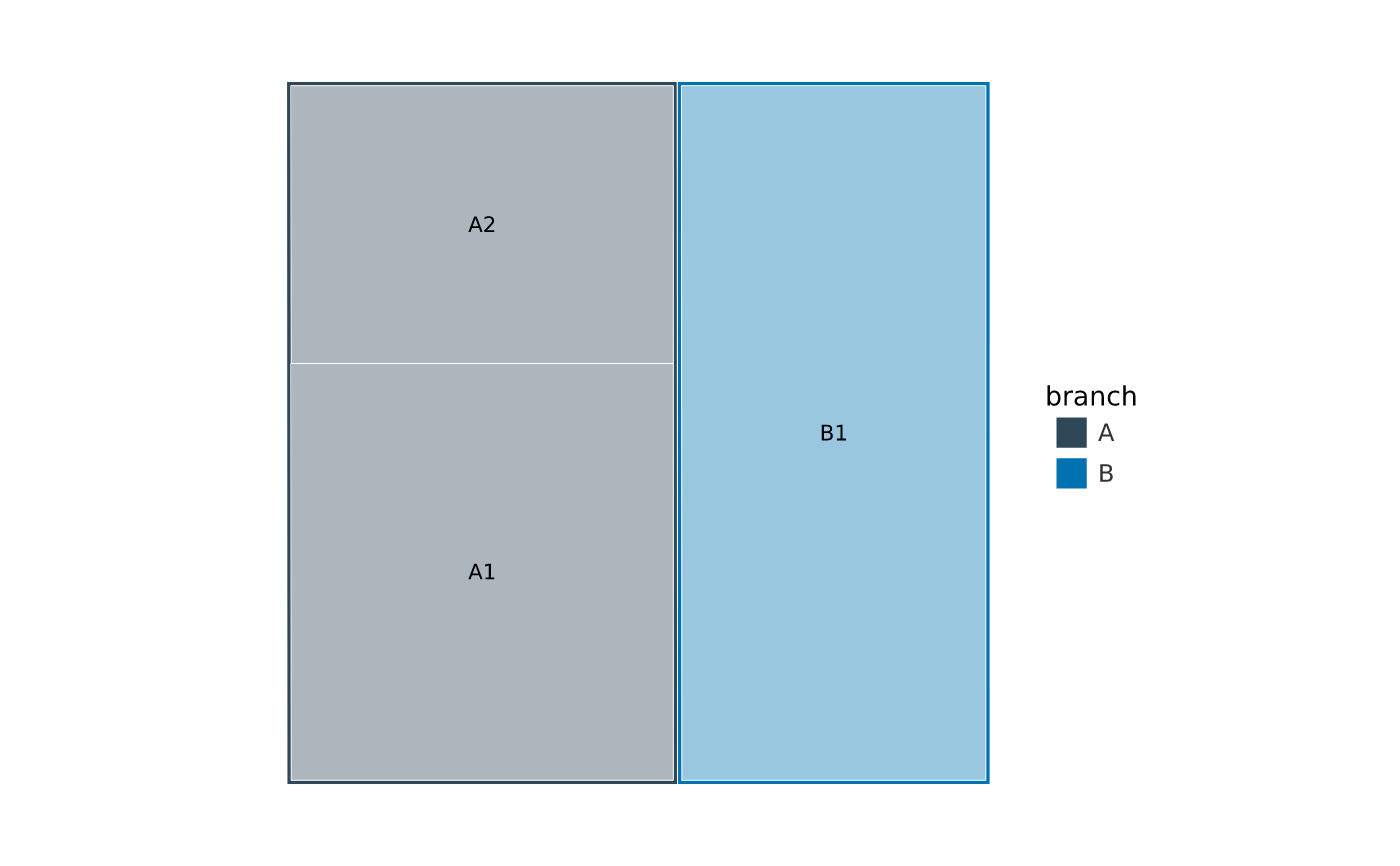
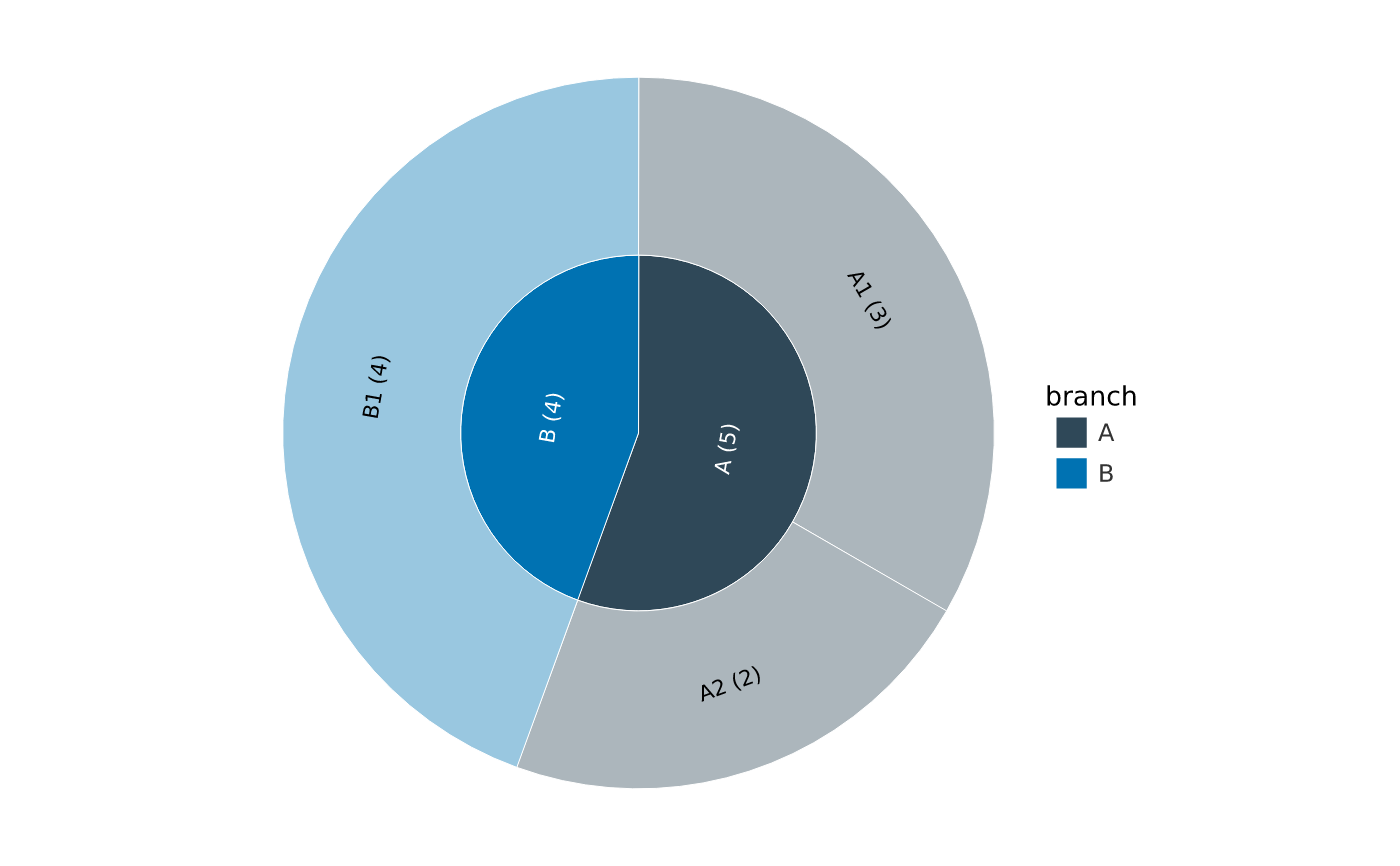
vhierarchy() draws a tree as a space-filling diagram, choosing the geometry
with type: "sunburst" (concentric ring sectors), "icicle" (rectangular
partition), "treemap" (squarified nested rectangles), or "circlepack"
(circles within circles). All four take the same parent list — id,
parent (NA/"" at the root), and value (leaf values; an internal node's
value is the sum of its children) — so switching type re-encodes the same
data. Like vgraph() / vsankey() it returns a ready, axis-free,
aspect-locked PlotSpec; mark_hierarchy() is the layer it adds.
Usage
vhierarchy(
  data,
  id,
  parent,
  value,
  fill = NULL,
  type = c("sunburst", "icicle", "treemap", "circlepack"),
  inner_radius = 0,
  flow = c("down", "up", "right", "left"),
  lighten = 0.6,
  label = TRUE,
  show_values = FALSE,
  orientation = c("auto", "radial", "tangential", "horizontal"),
  root_label = FALSE,
  width = 6,
  height = 6,
  dpi = 96
)

mark_hierarchy(
  plot,
  id,
  parent,
  value,
  fill = NULL,
  type = c("sunburst", "icicle", "treemap", "circlepack"),
  inner_radius = 0,
  flow = c("down", "up", "right", "left"),
  lighten = 0.6,
  label = TRUE,
  show_values = FALSE,
  orientation = c("auto", "radial", "tangential", "horizontal"),
  root_label = FALSE
)
Arguments
- data
A data frame describing a hierarchy (a parent list).
- id, parent, value
Columns (tidy-eval): the node id, its parent id (
NA/""for the root), and its value (used for leaves).- fill
Optional column (tidy-eval) to colour nodes by. Unmapped (default), nodes are coloured by their depth-1 branch and lightened with depth; mapped, each node takes its
fillvalue's colour with no depth fade.- type
Diagram geometry:
"sunburst"(default),"icicle","treemap", or"circlepack".- inner_radius
Sunburst only: central hole radius, a fraction in
[0, 1);0(default) fills to the centre.- flow
Icicle only: the direction of increasing depth —
"down"(default),"up","right", or"left".- lighten
Branch mode only: how far the deepest level fades toward white, a fraction in
[0, 1](default0.6;0= flat colour per branch). Ignored whenfillis mapped.- label
Label each node with its
id? DefaultTRUE. Nodes too small for their label are left unlabelled.- show_values
Append each node's value to its label, e.g.
"A1 (3)". DefaultFALSE.- orientation
Sunburst labels only:
"auto"(default) angles each label tangentially / radially to fit its wedge, or force"radial","tangential", or"horizontal". Labels are kept upright.- root_label
Write the root's name (and, with
show_values, its total) in the centre? DefaultFALSE. Most useful for"sunburst".- width, height, dpi
Page size (inches) and resolution.
- plot
A PlotSpec.
Value
A PlotSpec (vhierarchy()) or the modified plot (mark_hierarchy()).
Details
The root is structural and never drawn (in a sunburst it is the centre). Each
node is labelled with its id where the label fits, and show_values appends
the value; small nodes are left unlabelled so a dense diagram stays legible.
Colour
By default nodes are coloured by their depth-1 branch and lightened one step
per level, so sibling branches stay distinct and depth reads as shade. The
branch is an ordinary discrete fill scale, so scale_fill_*() recolours the
branches (e.g. scale_fill_brewer()), and lighten controls the depth fade
(0 = flat colour per branch). Map fill to a node column instead to colour
every node by that variable — discrete or continuous, with the matching
scale_fill_*() — in which case the depth fade is not applied.
Examples
h <- data.frame(
id = c("root", "A", "B", "A1", "A2", "B1"),
parent = c(NA, "root", "root", "A", "A", "B"),
value = c(NA, NA, NA, 3, 2, 4)
)
vhierarchy(h, id, parent, value, show_values = TRUE)
 vhierarchy(h, id, parent, value, type = "treemap")