Named convenience constructors for popular palettes, easing migration from
ggplot2. They are thin wrappers over the palette = argument of
scale_color_continuous() / scale_color_discrete() (any
grDevices::hcl.colors() name works there directly).
Usage
scale_color_viridis_c(
  plot,
  option = "viridis",
  breaks = NULL,
  labels = NULL,
  name = NULL
)

scale_color_viridis_d(
  plot,
  option = "viridis",
  breaks = NULL,
  labels = NULL,
  name = NULL
)

scale_fill_viridis_c(
  plot,
  option = "viridis",
  breaks = NULL,
  labels = NULL,
  name = NULL
)

scale_fill_viridis_d(
  plot,
  option = "viridis",
  breaks = NULL,
  labels = NULL,
  name = NULL
)

scale_color_brewer(
  plot,
  palette = "Blues",
  breaks = NULL,
  labels = NULL,
  name = NULL
)

scale_fill_brewer(
  plot,
  palette = "Blues",
  breaks = NULL,
  labels = NULL,
  name = NULL
)

scale_color_distiller(
  plot,
  palette = "Blues",
  breaks = NULL,
  labels = NULL,
  name = NULL
)

scale_fill_distiller(
  plot,
  palette = "Blues",
  breaks = NULL,
  labels = NULL,
  name = NULL
)

scale_colour_viridis_c(
  plot,
  option = "viridis",
  breaks = NULL,
  labels = NULL,
  name = NULL
)

scale_colour_viridis_d(
  plot,
  option = "viridis",
  breaks = NULL,
  labels = NULL,
  name = NULL
)

scale_colour_brewer(
  plot,
  palette = "Blues",
  breaks = NULL,
  labels = NULL,
  name = NULL
)

scale_colour_distiller(
  plot,
  palette = "Blues",
  breaks = NULL,
  labels = NULL,
  name = NULL
)
Arguments
- plot
A PlotSpec.
- option
Which viridis map (see above).
- name, breaks, labels
As for
scale_color_continuous().- palette
A
grDevices::hcl.colors()palette name.
Value
The modified PlotSpec.
Details
scale_*_viridis_c()/scale_*_viridis_d()— the perceptually-uniform, colour-vision-deficient-safe viridis maps, continuous (_c) or discrete (_d).optionpicks the map:"viridis","plasma","inferno","cividis","rocket", or"mako"(unknown options fall back to viridis).scale_*_brewer()— a discrete ColorBrewer-style qualitative/sequential palette;scale_*_distiller()— the same ramp interpolated for continuous data.paletteis anyhcl.colors()name (e.g."Blues","Set 2").
Examples
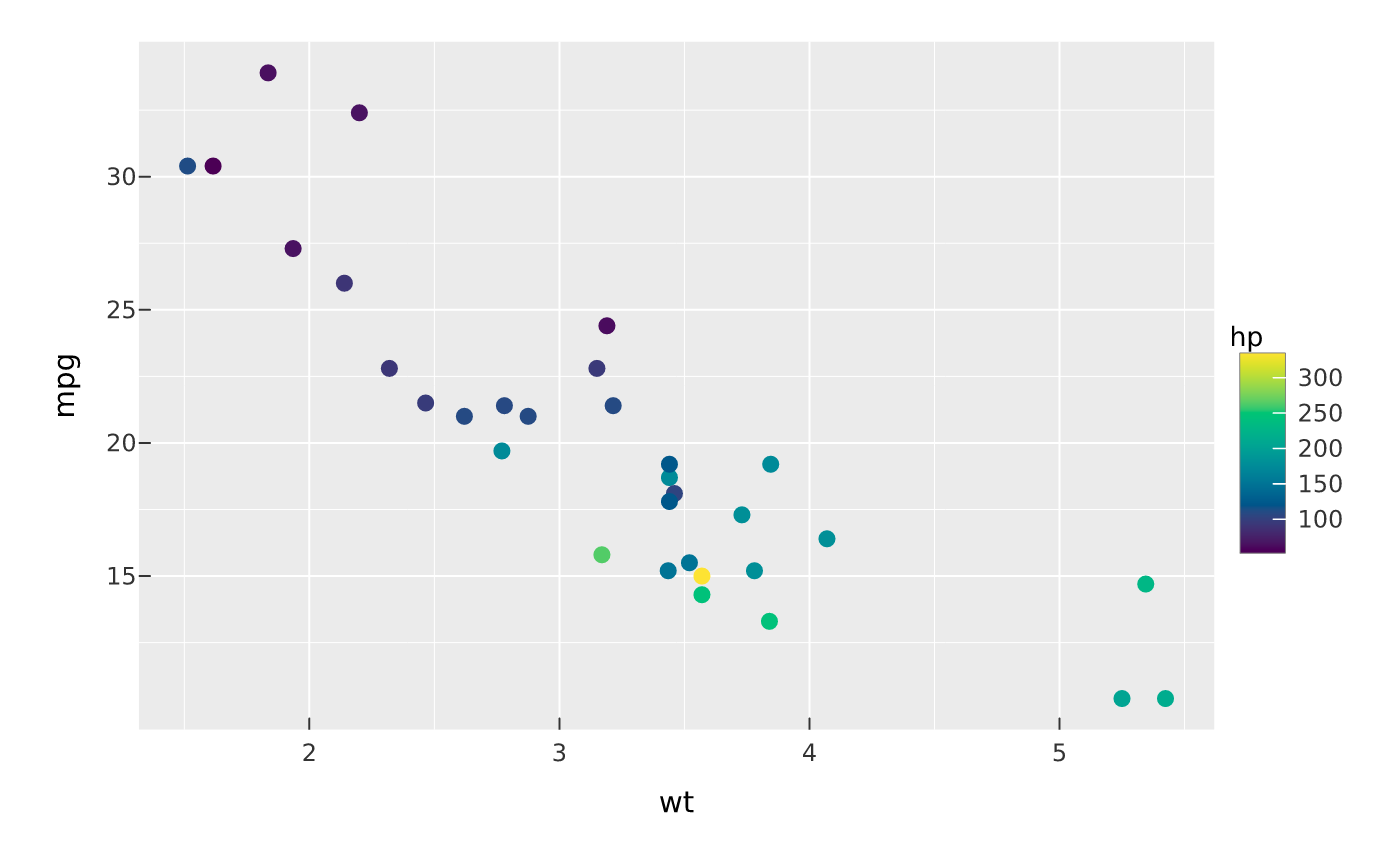
vplot(mtcars) |> mark_point(x = wt, y = mpg, color = hp) |> scale_color_viridis_c()
 vplot(mtcars) |>
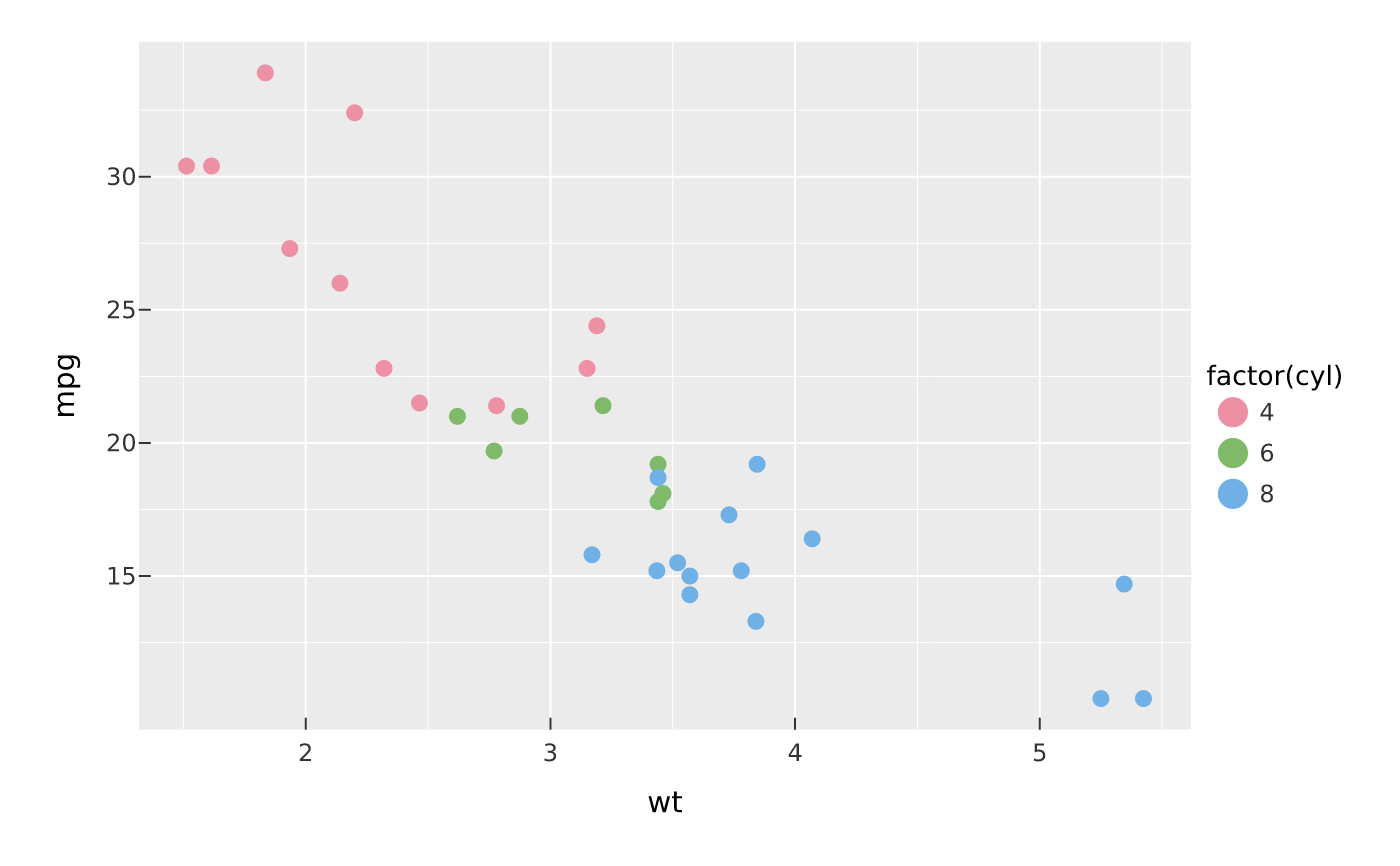
mark_point(x = wt, y = mpg, color = factor(cyl)) |>
scale_color_brewer(palette = "Set 2")
vplot(mtcars) |>
mark_point(x = wt, y = mpg, color = factor(cyl)) |>
scale_color_brewer(palette = "Set 2")