Declare a colour scale for the color/fill channel. Continuous data get a
perceptual ramp; discrete data get a qualitative palette. scale_*_manual()
sets exact colours, scale_*_gradient() a two-point ramp, and
scale_*_gradient2() a diverging three-point ramp (low–mid–high)
centred on midpoint — for signed or anomaly data where a meaningful zero
should sit at the neutral colour. The fill variants are identical (colour and
fill share one scale). A legend is drawn automatically when colour is mapped.
Usage
scale_color_continuous(
  plot,
  palette = NULL,
  limits = NULL,
  breaks = NULL,
  labels = NULL,
  name = NULL
)

scale_color_discrete(
  plot,
  palette = NULL,
  breaks = NULL,
  labels = NULL,
  name = NULL
)

scale_color_manual(plot, values, name = NULL)

scale_color_gradient(plot, low = "#132B43", high = "#56B1F7", name = NULL)

scale_color_gradient2(
  plot,
  low = "#832424",
  mid = "#FFFFFF",
  high = "#3A3A98",
  midpoint = 0,
  name = NULL
)

scale_fill_continuous(
  plot,
  palette = NULL,
  limits = NULL,
  breaks = NULL,
  labels = NULL,
  name = NULL
)

scale_color_gradientn(plot, colours, name = NULL)

scale_fill_gradientn(plot, colours, name = NULL)

scale_colour_gradientn(plot, colours, name = NULL)

scale_fill_discrete(
  plot,
  palette = NULL,
  breaks = NULL,
  labels = NULL,
  name = NULL
)

scale_fill_manual(plot, values, name = NULL)

scale_fill_gradient(plot, low = "#132B43", high = "#56B1F7", name = NULL)

scale_fill_gradient2(
  plot,
  low = "#832424",
  mid = "#FFFFFF",
  high = "#3A3A98",
  midpoint = 0,
  name = NULL
)

scale_colour_continuous(
  plot,
  palette = NULL,
  limits = NULL,
  breaks = NULL,
  labels = NULL,
  name = NULL
)

scale_colour_discrete(
  plot,
  palette = NULL,
  breaks = NULL,
  labels = NULL,
  name = NULL
)

scale_colour_manual(plot, values, name = NULL)

scale_colour_gradient(plot, low = "#132B43", high = "#56B1F7", name = NULL)

scale_colour_gradient2(
  plot,
  low = "#832424",
  mid = "#FFFFFF",
  high = "#3A3A98",
  midpoint = 0,
  name = NULL
)
Arguments
- plot
A PlotSpec.
- palette
A vector of colours, or a single palette name passed to
grDevices::hcl.colors()(e.g."Batlow","Blues","Set 2"; matched case/space-insensitively).NULLuses a sensible default.- limits
For the continuous colour scales, a length-2 numeric
c(min, max)fixing the mapped data range (the direct form oflims(color = ...)).- breaks, labels
Explicit legend breaks / labels, or
NULL.- name
Legend title, or
NULLto derive from the encoding.- values
For
scale_*_manual(), a vector of colours; if named, matched to data levels by name (unmatched levels draw grey).- low, high
For
scale_*_gradient()/scale_*_gradient2(), the endpoint colours.- mid
For
scale_*_gradient2(), the midpoint colour.- midpoint
For
scale_*_gradient2(), the data value placed atmid(default0); values above and below diverge tohighandlow.- colours
For
scale_*_gradientn(), an n-stop vector of colours the continuous ramp interpolates through.
Value
The modified PlotSpec.
Details
Continuous and binned ramps built from a plain colour vector are interpolated
in the perceptually-uniform Oklab space, so they avoid the muddy, over-dark
midtones and hue drift of sRGB blending. Designed perceptual palettes (the
default, and hcl.colors() names) are already uniform and unaffected. Set
options(vellumplot.color.interpolation = "srgb") (or "lab") to change the
blend space globally.
Examples
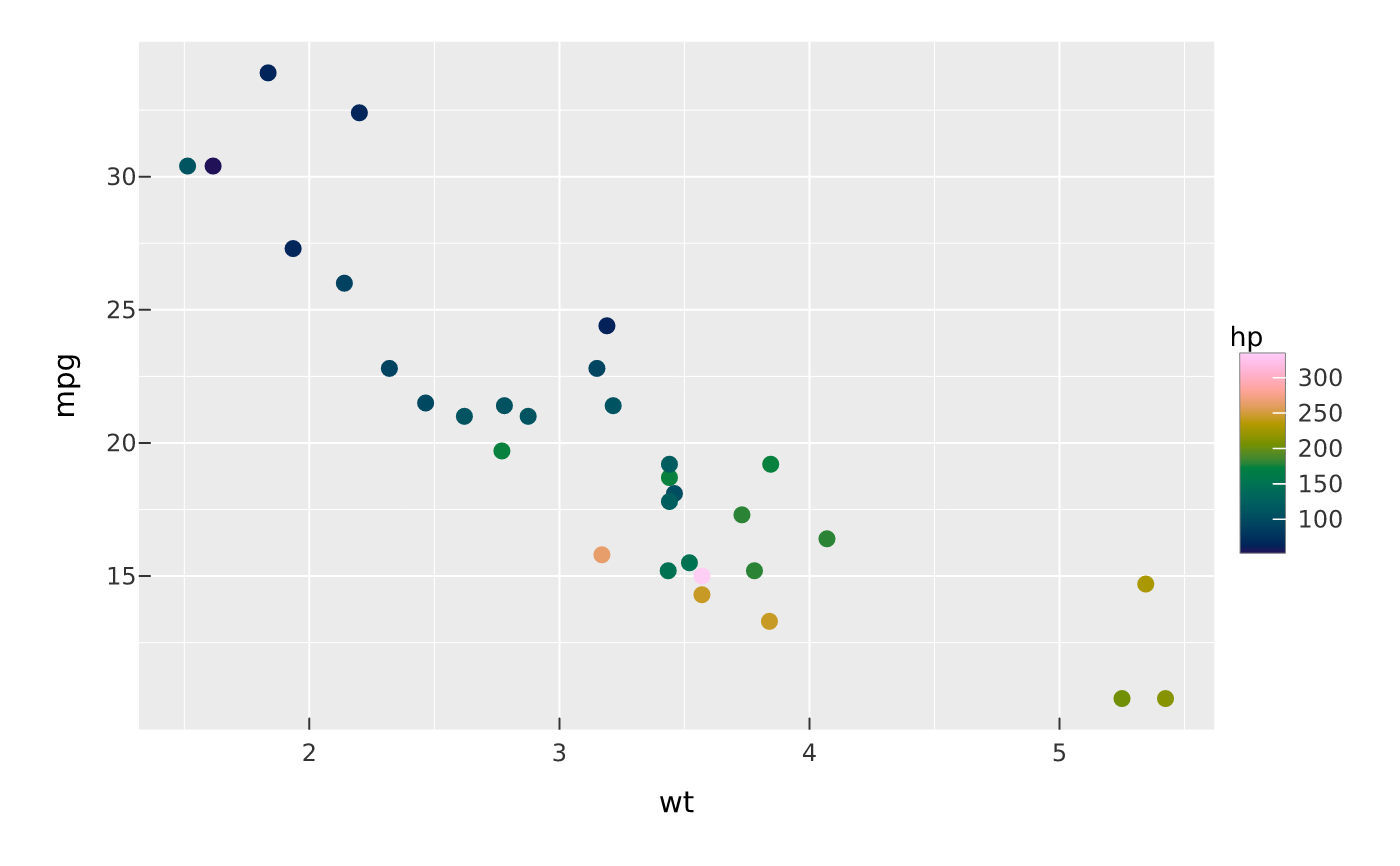
vplot(mtcars) |>
  mark_point(x = wt, y = mpg, color = hp) |>
  scale_color_continuous(palette = "Batlow")